Figure 2.

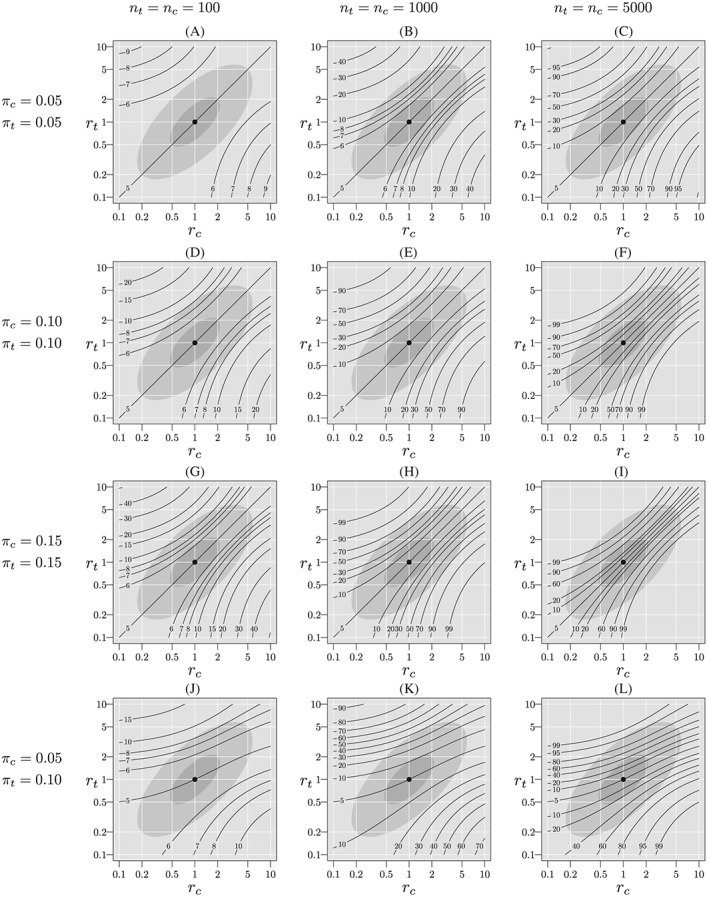
Probability of rejection of (%) when H 0 is true, p t=p c=0.3, varying π t, π c, n t, and n c. The light gray ellipse corresponds to the skeptical plausibility region, , and the darker gray ellipse corresponds to the optimistic region,

Probability of rejection of (%) when H 0 is true, p t=p c=0.3, varying π t, π c, n t, and n c. The light gray ellipse corresponds to the skeptical plausibility region, , and the darker gray ellipse corresponds to the optimistic region,