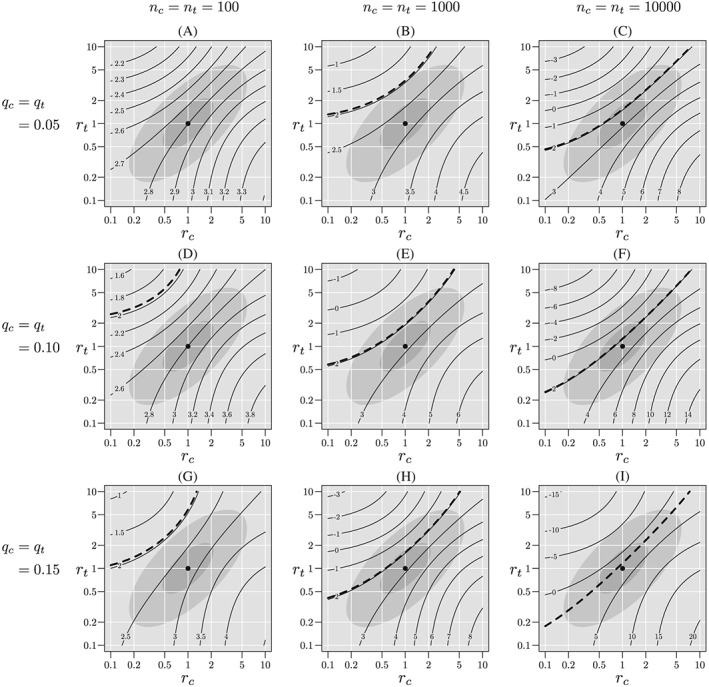
Figure 3.

Sensitivity analyses for tables with approximately the same complete‐case Z statistic, but differing sample sizes and missingness probabilities. The light gray ellipse corresponds to the skeptical plausibility region, , and the darker gray ellipse corresponds to the optimistic region, . The heavy dashed contour line corresponds to Z=1.96. If this line is contained in the plausible region, we cannot reject H 0 at the (one‐sided) 0.025 level
