Fig. 2.
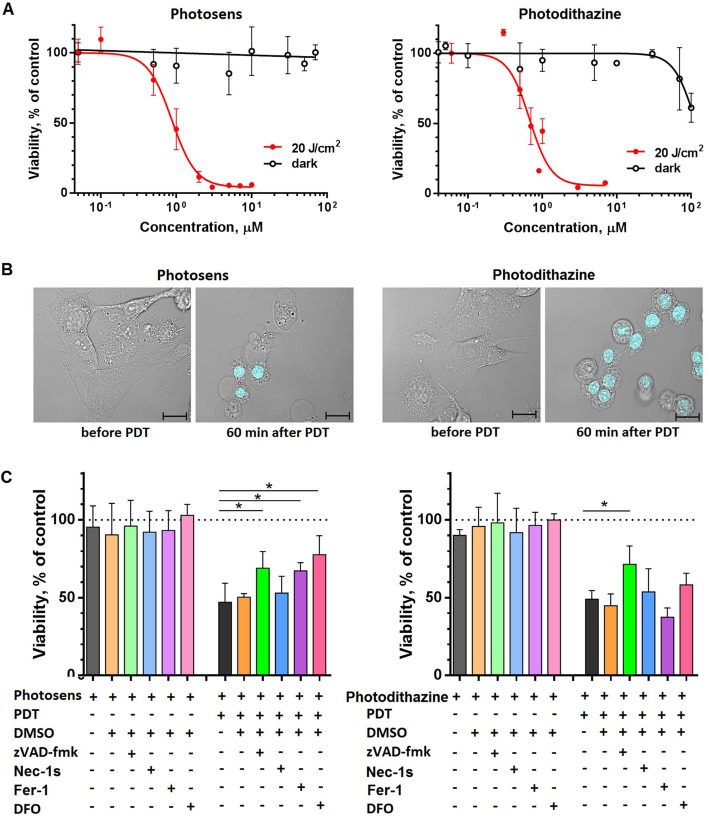
Cell death analysis by MTT assay in cancer cells treated with PDT-PS or PDT-PD. a Dark toxicity (black lines) was analyzed after incubating GL261 cells with the respective photosensitizer in serum-free medium for 24 h. For PDT-induced cell death (red lines), cells were first incubated with 10 μM PS or PD in serum-free medium for 4 h and then they were irradiated with a light dose of 20 J/cm2 using a LED light source (615–635 nm). MTT assays were performed 24 h after irradiation. #IC50 for PS was 0.96 μM [0.79–1.18] and for PD 0.8 μM [0.67–0.92]; the values were calculated with 95% confidence intervals (3 to 5 individual experiments with three replicates in each). b Morphology of GL261 cells before and 60 min after PDT. Cells were stained with propidium iodide (blue). Scale bars, 20 μm. c Effect of different inhibitors on cell death of GL261 cells induced by PS-PDT or PD-PDT. The following inhibitors were used: 25 μM zVAD-fmk (apoptosis), 20 μM Necrostatin-1 s (necroptosis), and 1 μM Ferrostain-1 or 10 μM DFO (ferroptosis). Cell death in GL261 cells induced by PS-PDT was significantly blocked by zVAD-fmk, ferrostatin-1, and DFO. In contrast, cell death induced by PD-PDT was inhibited only by zVAD-fmk. Cells were first incubated with 10 μM PS or PD in the presence of the respective cell death inhibitor in serum-free medium for 4 h and then the medium was replaced to photosensitizer-free medium followed by irradiation at 20 J/cm2 using a LED light source (615–635 nm). After irradiation, the respective inhibitor was added again. MTT assays were performed 13 h after irradiation. Cell viability of the untreated control (no photosensitizer or inhibitor) was set as 100% (dotted line). The values are the means ±SEM. Statistical significance was calculated by using t-criteria with Bonferroni correction, *p < 0.05; #IC50 values are given with 95% confidence interval

