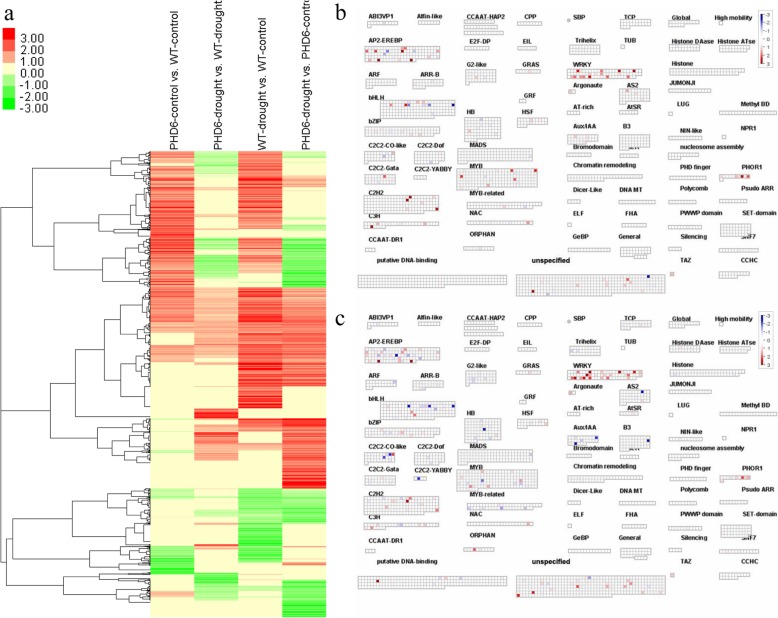
Fig. 6.
Gene cluster analysis and transcription factors changed byMtPHD6 transgene or drought treatment. a: Cluster analysis of all genes modulated by MtPHD6 transgene or drought stress; b and c: Transcription factors regulated by MtPHD6 transgene or drought stress. Red squares represent up-regulated genes; blue squares mean down-regulated genes; and white squares mean no significant changes. The original data were presented in Additional file 6: Table S6

