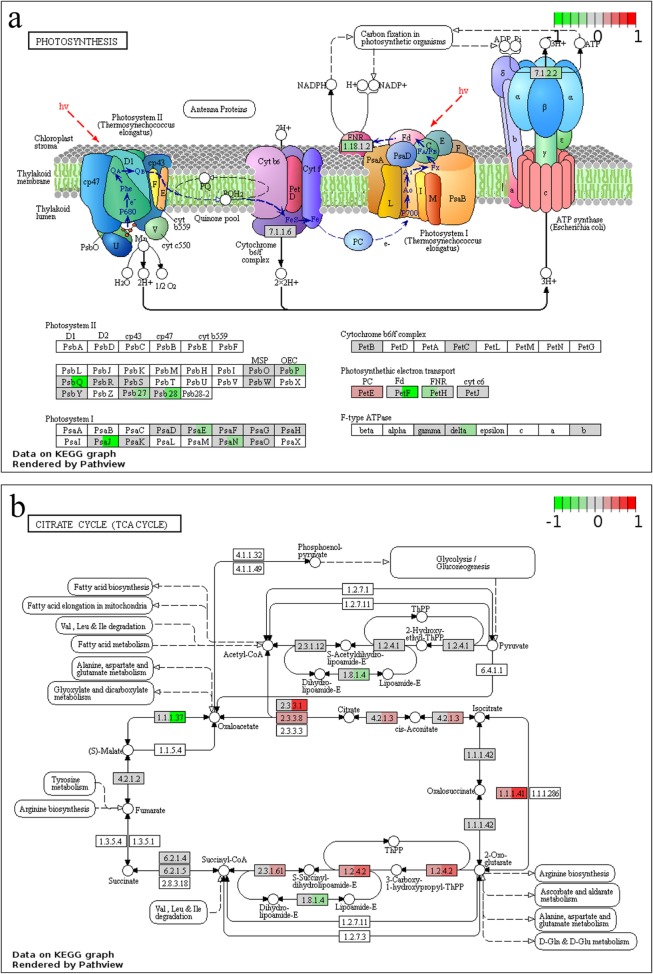
Fig. 8.
Photosynthesis (a) and TCA cycle (b) related genes changed by MtPHD6 transgene or drought. KEGG pathway changes were analyzed using Pathview (https://pathview.uncc.edu/home). Each rectangle was divided into 2 subsections, which represent genes modulated by MtPHD6 transgene (MtPHD6-control vs. WT-control) and drought (WT-drought vs. WT-control), respectively. Red means upregulation and green means downregulation

