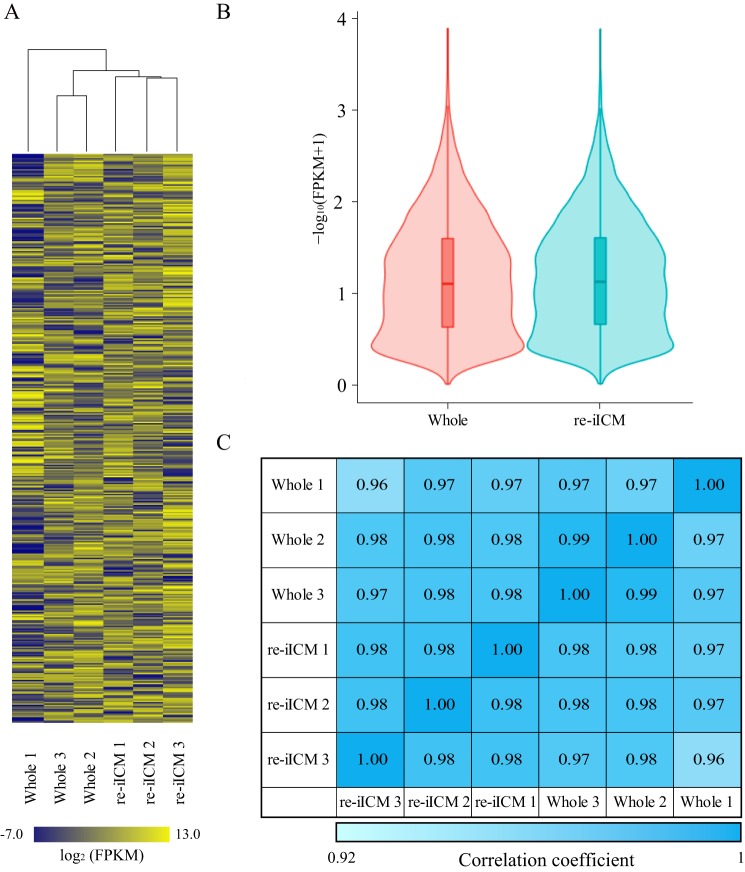
Figure 4.
Global gene expression analysis in bovine re-iICM using RNA-seq. A, heatmap representing the similarity of whole blastocyst and re-iICM in cattle. Hierarchical clustering alongside the heatmap shows the relation between inter-sample identities and similar expression patterns. Color scale represents the FPKM value from yellow (maximum) to blue (minimum). Gene expression levels are represented as FPKM values that are transformed by common logarithm with base 2. A total of 9509 genes (rows) were covered in each sample cluster (columns). B, violin plots of RNA-seq–based expression data for all 9509 genes in whole blastocysts and re-iICMs. Red and sky blue shapes show the distribution of the FPKM values for individual genes. Horizontal lines indicate group medians. C, to further confirm the similarity between Whole blastocyst and re-iICM gene expression patterns, we calculated the Pearson correlation coefficients for each sample. The values denote Pearson correlation coefficient (R2) of log2 (FPKM + 1) between samples. R2 >0.92 was considered “similarity” between two samples. Color scale represents the relative level of R2 from blue (high) to light blue (low).

