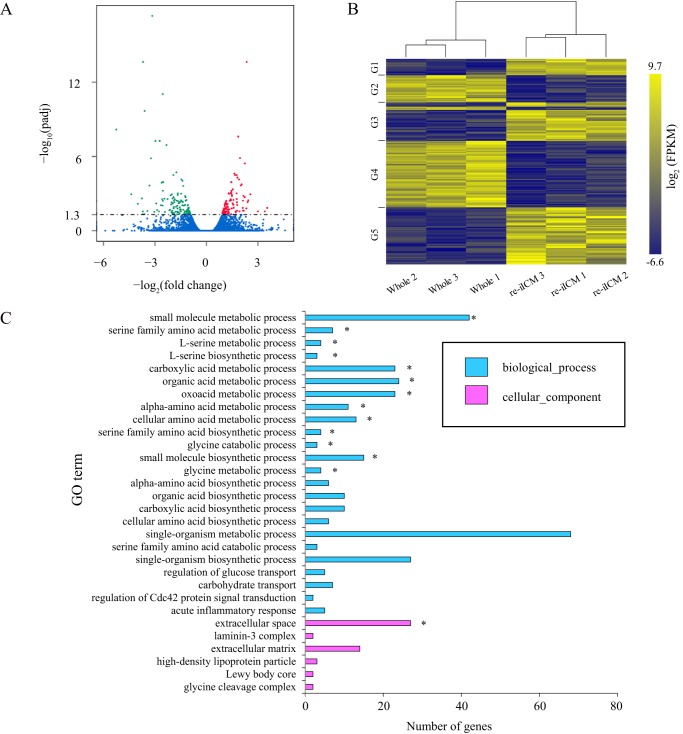
Figure 5.
Functional characterization of differentially-expressed genes in bovine re-iICM compared with those in Whole blastocyst. A, volcano plots show differentially-expressed genes in re-iICM compared with those in Whole blastocyst. Trimmed mean of M of each gene is plotted. The horizontal axis shows the fold-change in gene expression of re-iICM to that of Whole, and the vertical axis shows the p value after multiple comparison correction (Padj). Padj < 0.05 was considered statistically significant, the logarithmic value (=1.3) of which is indicated by a dashed line. Significantly up- and down-regulated genes are highlighted in red and green, respectively. Blue indicates genes showing no significant differential expression. B, heatmap representing the difference in whole blastocyst and re-iICM in cattle. Hierarchical clustering alongside the heatmap was performed using 188 genes that were differentially expressed and had raw FPKM >0 in the bovine re-iICMs (A). The gene sets corresponding to each group (G1 to 5) are shown in Table S3. C, GO enrichment analysis of differentially-expressed genes in re-iICM. The top 30 GO terms representing the functions known for these differentially-expressed genes are shown. The horizontal axis represents the number of differentially-expressed genes involved in a certain GO category, and the vertical axis shows GO terms enriched. The enriched GO terms are marked by an asterisk (p < 0.05).

