Figure 1.
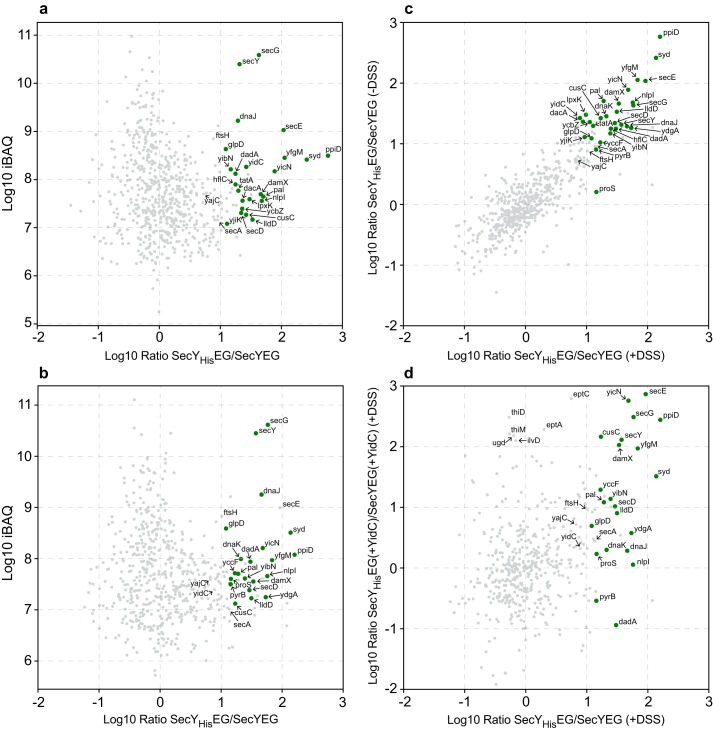
SecYEG interactome of E. coli. A, SecYEG or SecYHisEG was expressed in E. coli, and subsequently, SecYEG/SecYHisEG was purified via metal-affinity chromatography and subjected to MS analyses as described under “Experimental procedures” (n = 4). The x axis displays the log10 intensity ratio of the respective protein in the SecYHisEG (His)/SecYEG (Ctl) pulldowns. The y axis displays the log10 of the total iBAQ value. Specific interactors of the SecYEG complex are marked by green dots. B, as in A but protein–protein interactions were stabilized by on-column cross-linking using the chemical cross-linker DSS. C, comparison of mean log10 ratios of DSS-treated (x axis) against the mean log10 ratios of nonDSS-treated samples (y axis). D, comparison of the mean log ratios of SecYEG-interacting proteins from cells without (x axis) or with (y axis) simultaneous YidC expression. The analyses were performed after on-column cross-linking. A complete list of all proteins is shown in Table S1.

