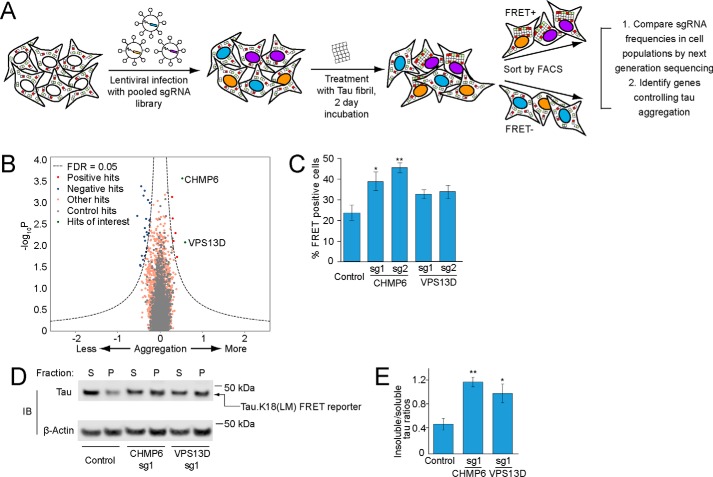
Figure 2.
CRISPRi screen for cellular factors controlling tau aggregation. A, strategy for pooled FRET-based CRISPRi screen. FRET reporter cells stably expressing the CRISPRi machinery (dCas9-BFP-KRAB) were transduced with pooled lentiviral expression libraries of sgRNAs targeting proteostasis genes. Following transduction and selection, cells were treated with tau fibrils and incubated for 2 days. Cells were detached and sorted into FRET-negative and -positive populations by FACS. sgRNA-encoding cassettes were amplified from genomic DNA of the cell populations and their frequencies were quantified using next generation sequencing to identify genes that control tau aggregation. B, volcano plot summarizing phenotypes and statistical significance (by our MAGeCK-iNC pipeline, see “Experimental procedures”) of the genes targeted by the sgRNA libraries. Nontargeting sgRNAs were randomly grouped into negative control “quasi-genes” (gray dots) to derive an empirical false discovery rate (FDR). Hit genes that passed an FDR < 0.05 threshold are shown in blue (knockdown decreases aggregation) or red (knockdown increases aggregation), other genes are shown in orange. Two hit genes of interest are shown in green and labeled. C–E, validation of hit genes CHMP6 and VPS13D. FRET reporter cells transduced with individual sgRNAs targeting two hit genes or a nontargeting control sgRNA, and 5 days after transduction treated for 2 days with tau fibrils. C, % of FRET-positive cells was quantified by flow cytometry. Error bars represent mean ± S.D. of n = 3 technical replicates. *, p < 0.05; **, p < 0.01 (two-tailed Student's t test for comparison to the nontargeting control sgRNA). D, representative immunoblot for the tau fluorescent protein construct in the soluble and insoluble fractions as in Fig. 1H. E, quantification of insoluble/soluble tau ratios from immunoblots in D. Error bars represent mean ± S.D. for n = 3 biological replicates. *, p < 0.05; **, p < 0.01 (two-tailed Student's t test for comparison to the nontargeting control sgRNA).

