Figure 4.
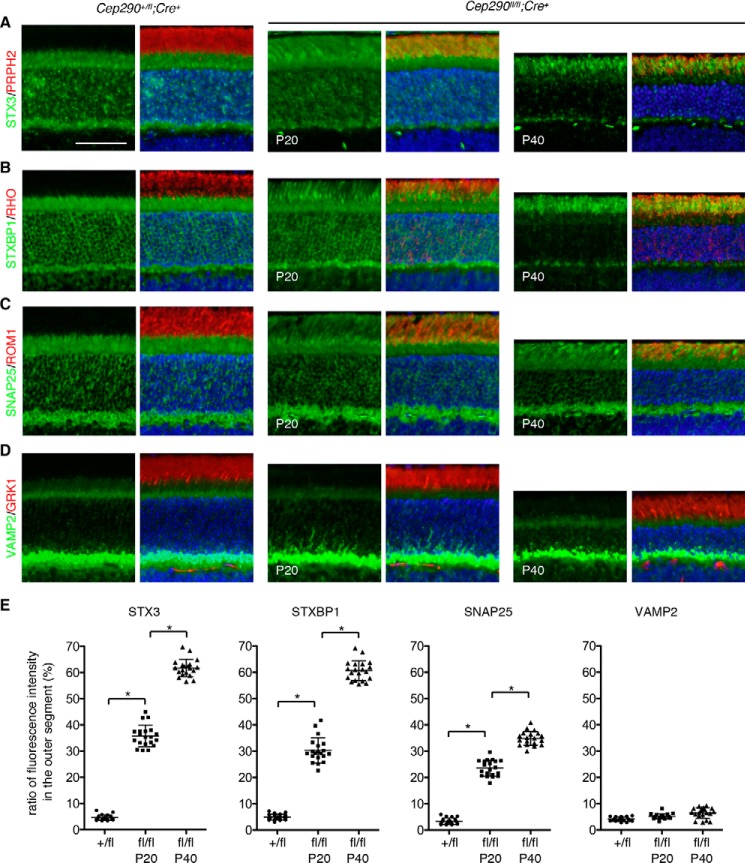
Localization of STX3 and its interacting proteins in Cep290fl/fl;Cre+ mice. Control (Cep290+/fl;Cre+ at P20) and Cep290fl/fl;Cre+ (at P20 and P40) mouse retinal sections were immunostained with STX3 (A), STXBP1 (B), SNAP25 (C), and VAMP2 (D) antibodies (green). To delineate outer segments, sections were co-stained with PRPH2, RHO, ROM1, and GRK1 antibodies (red). DAPI was used to label nuclei (blue). Merged images are shown on the right. Five animals, both male and female, were used per group, and representative images are shown. Scale bar represents 50 μm. E, quantification of inner segment protein mislocalization to the outer segment. Depicted are ratios of integrated fluorescence intensities in the outer segment relative to the photoreceptor cell layer. Data are from five mice (two sections per mouse and two areas per section). Mean and standard deviation (S.D.; error bar) are shown. Asterisks indicate statistical significance (two-tailed, two-sample t test assuming unequal variances; p < 0.01).

