Figure 1.
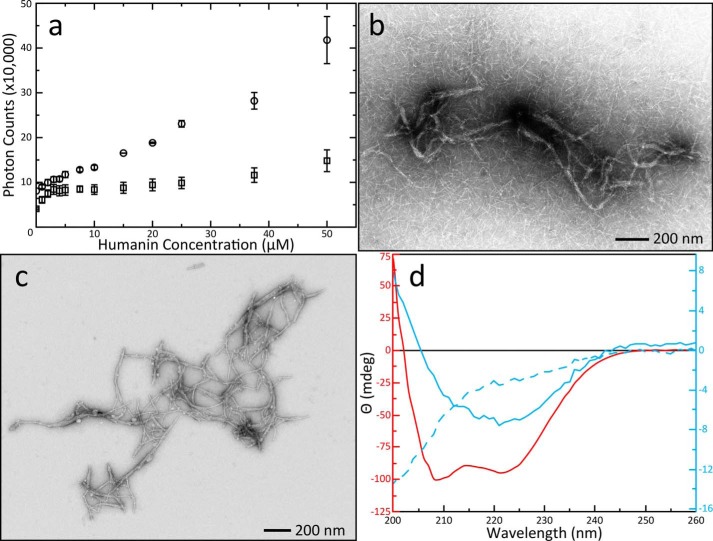
Formation of HN aggregations, EM imaging of novel fibers, and secondary structure characterization. A, increase of scattered photons from a 280 nm laser caused by aggregations in solution as a function of HN concentration in the presence (circle) or absence (square) of 5 μm BAX. Error bars were calculated from the S.D. of three replicate titrations. Control titrations of buffer alone into BAX did not show increased light scattering. B, EM images of aggregations revealed multifibrous superstructures with a background of single fibers. The contrast in this image was enhanced with 0.5% pixel saturation by histogram stretching. C, EM of centrifuge-purified fibers. The expanded view shows fibers stacked against each other forming bundles with some individual fibers associating with multiple bundles. Fibers can also appear alone or associated in nonparallel configurations but are not branching. This image is unaltered from the original data collection. D, CD spectra of centrifuge purified fibers and control samples. Data are displayed with multiple y-axes as described in “Experimental procedures” and spectra are color-coordinated with their axes. Spectra were produced from three accumulated scans on a single sample. Fibers separated from a solution of 50 μm BAX and 500 μm HN (solid blue line) produced a spectrum with a single valley at 222 nm indicating the presence of predominantly anti-parallel β-sheets. A control spectrum of 25 μm BAX (solid red line) yielded two minima showing the globular α-helical BAX structure; the 50 μm HN spectrum (dashed blue line) reflected disordered conformation.

