Figure 3.

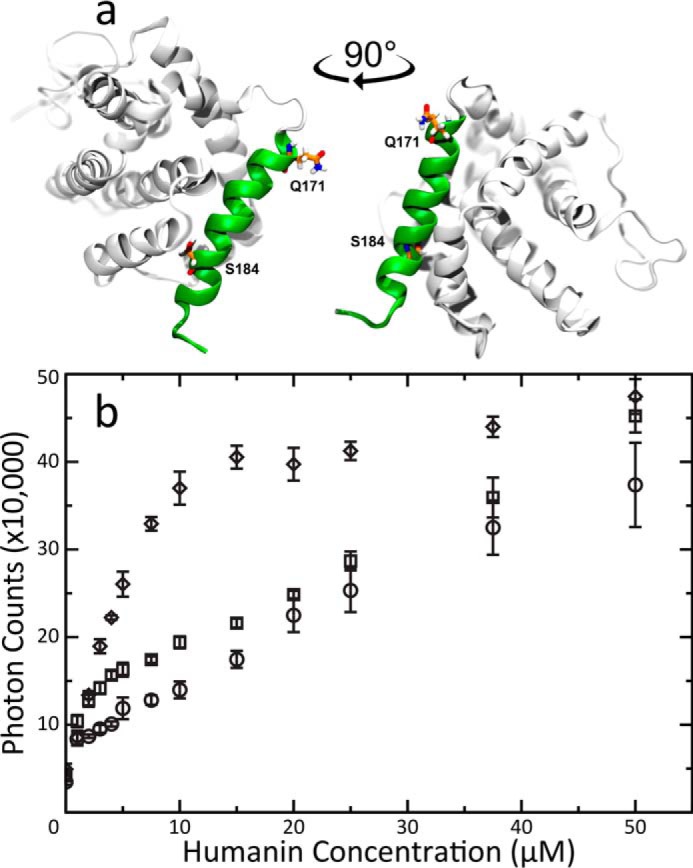
Solvent-exposed α9 propagates fiber formation. A, The NMR structure of BAX (PDB 1F16) highlighting the changes made by mutations. Residues Gln-171 and Ser-184 are rendered in sticks. Gln-171 is the final residue in the C-terminal truncated mutant. Helix 9 is rendered in green. BAX models were created using Visual Molecular Dynamics (68). B, Light scattering titrations of HN into 5 μM solutions of either WT (circle), BAX ΔC (square) or S184V (diamond) mutant BAX. Error bars were calculated from the standard deviation of three replicate titrations. BAX ΔC fibrillation has a slight rate enhancement during the sub-stoichiometric phase of the titration but eventually averages into the WT BAX curve. In contrast BAX S184V, with its flexible α9 helix, shows a greatly enhanced fiber formation rate.
