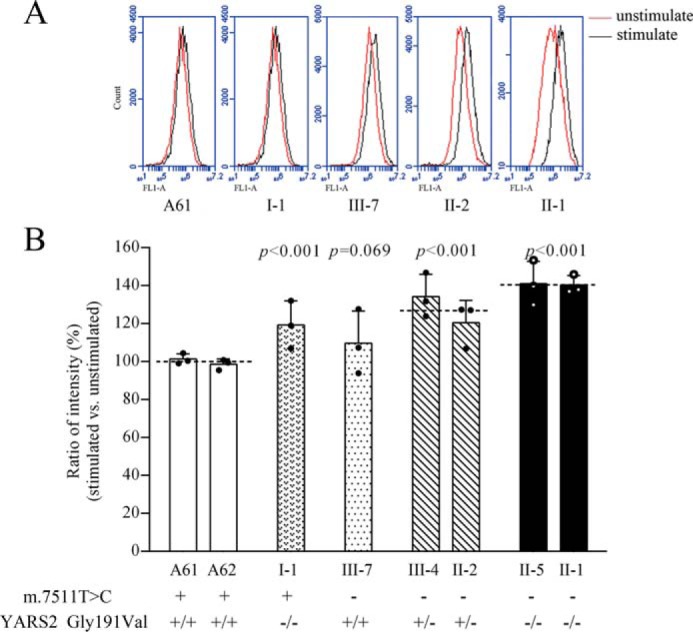
Figure 9.

Measurement of ROS. Shown is the ratio of geometric mean intensity between the levels of ROS generation in the vital cells with or without H2O2 stimulation. The rates of total ROS production in various cell lines were analyzed by measurement of fluorescence using a BD Accuri C6 flow cytometer system. A, flow cytometry histogram showing fluorescence of cell lines without (red) or with (black) H2O2 stimulation. B, relative ratios of fluorescence intensity were calculated in the absence and presence of H2O2. The average of three determinations for each cell line is shown. Graph details and symbols are explained in the legend to Fig. 2.
