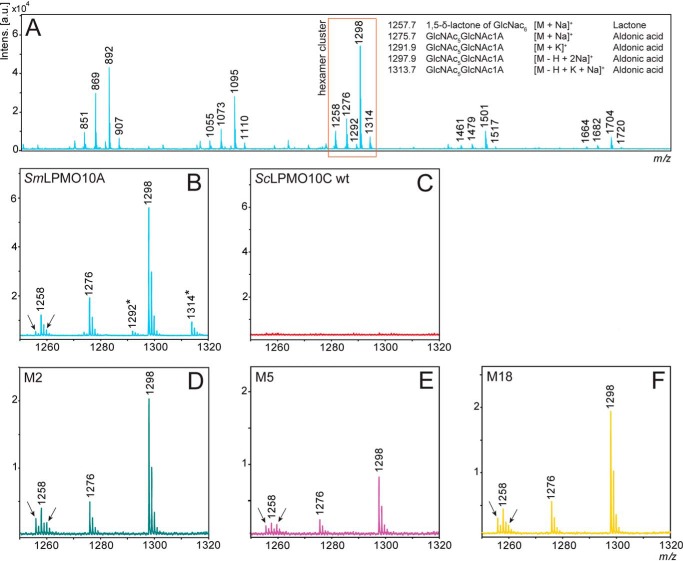
Figure 3.
Oxidized products generated from chitin. A shows the results of MALDI-ToF MS analysis after a 24-h incubation of the positive control LPMO (SmLPMO10A) with 10 g/liter β-chitin at 40 °C in sodium phosphate (pH 6.0) in the presence of 1 mm ascorbic acid (reducing agent) and displays the C1-oxidized products (aldonic acids and lactones) that can be expected for a chitin-active LPMO. Peaks representing oxidized chito-oligomers are marked with their m/z value (see A for details). B shows a zoom-in view of the hexamer cluster displaying SmLPMO10A-generated products within the 1250 to 1320 m/z range. The peaks that are marked with an asterisk represent potassium adducts, which are absent in the spectra for the ScLPMO10C mutants due to different storage buffers (SmLPMO10A was stored in potassium phosphate (pH 6.0), and the ScLPMO10C mutants in sodium phosphate (pH 6.0)). C shows a zoom-in view of the hexamer cluster area for WT ScLPMO10C and shows no oxidized products. D–F display zoom-in views of the hexamer cluster area for mutants M2, M5, and M18, respectively. Arrows in B, D–F indicate minor signals at m/z = 1256 and m/z = 1260 that are more prominent in the mutants (relative to the signals for regular oxidized products) compared with SmLPMO10A.

