
Figure 3.
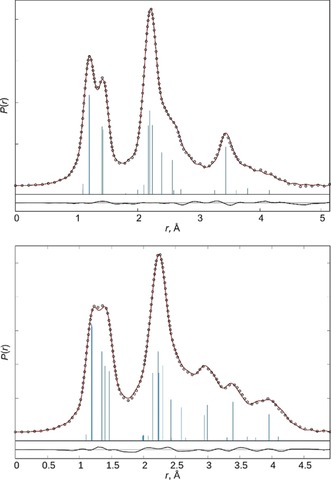
Experimental (circles) and model (line) radial distribution functions of MN (top) and FMN (bottom). The line below is the difference curve. Vertical bars indicate interatomic distances in the molecule.
Official websites use .gov
A
.gov website belongs to an official
government organization in the United States.
Secure .gov websites use HTTPS
A lock (
) or https:// means you've safely
connected to the .gov website. Share sensitive
information only on official, secure websites.
Experimental (circles) and model (line) radial distribution functions of MN (top) and FMN (bottom). The line below is the difference curve. Vertical bars indicate interatomic distances in the molecule.