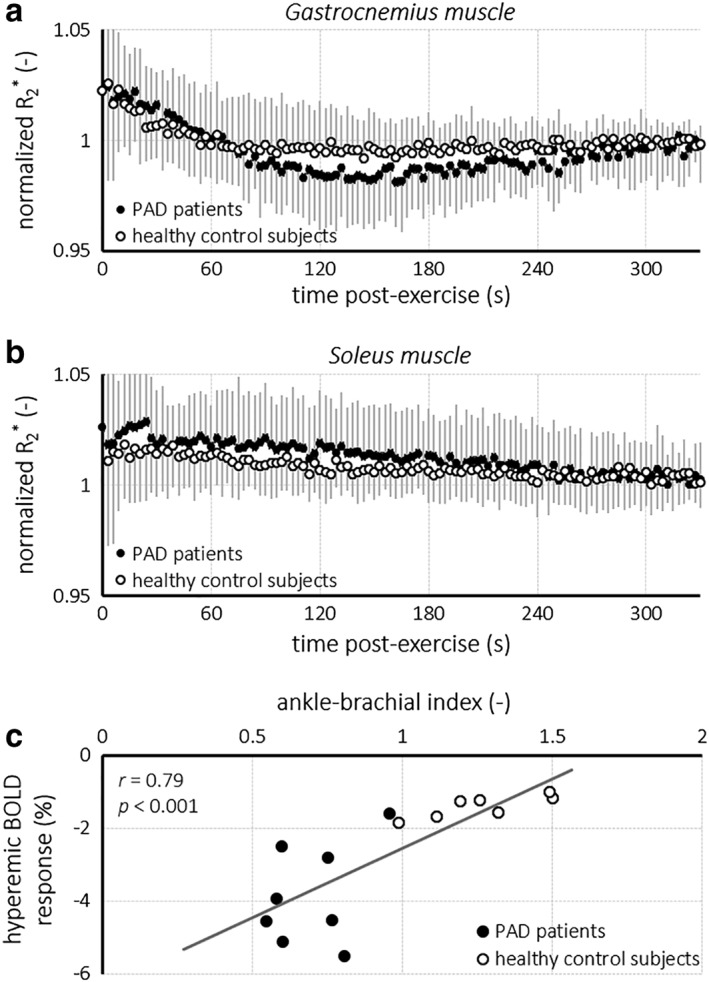
Figure 2.

Time curves of the normalized R2* for the gastrocnemius muscle (a) and soleus muscle (b) for PAD patients (shaded circles) and healthy control subjects (open circles) obtained during recovery after plantar flexion exercise. The amplitude of the hyperemic BOLD response in the gastrocnemius muscle correlated (r = 0.79; P < 0.001) with the ABI for PAD severity (c). BOLD, blood oxygenation level‐dependent.
