Figure 3.

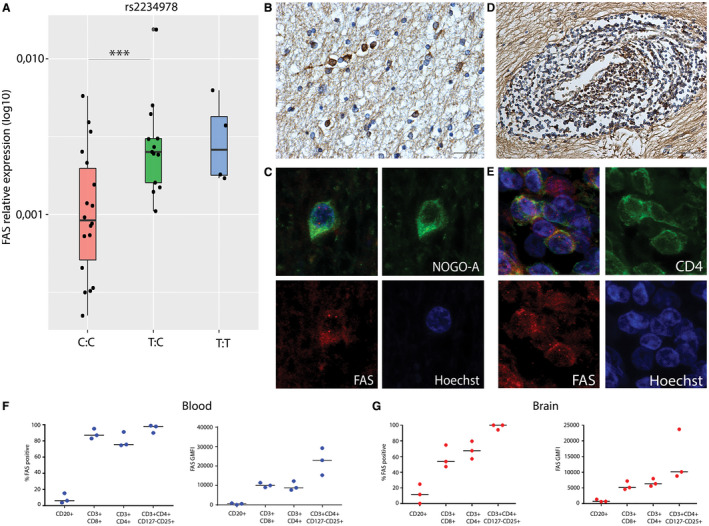
rs2234978/FAS and FAS expression in MS autopsy tissue. A. relative expression of FAS with qPCR, heterozygotes showed an increased relative expression of FAS compared to major allele homozygotes C:C n = 22 T:C n = 14 T:T n = 4 ***P < 0.001. B. Immunohistochemistry for FAS on active and mixed active/inactive MS lesions showed FAS expression by oligodendrocytes around a mixed active/inactive lesions. (40× magnification, scalebar represents 250 um) C. Colocalization of FAS with NOGO‐A, showing it is expressed by oligodendrocytes around MS lesions. (63× magnification) D. FAS expression by lymphocytes in the perivascular space. (20× magnification, scalebar represents 500 um) E. Colocalization of FAS with CD4, showing it is expressed by T cells in MS lesions. (63× magnification) F. FAS protein expression in lymphocytes derived from blood, showing the percentage of FAS positive cells and geometric mean fluorescence intensity (GMFI) for FAS on CD20, CD4, CD8 and CD127‐CD25+CD4+ T cells. FAS is expressed by CD4 and CD8 T cells and suggested to be increased in the CD127‐CD25+ T cell population that is enriched for T‐regulatory phenotype. G. FAS protein expression in lymphocytes derived from normal appearing white matter brain tissue, showing the percentage of FAS positive cells and GMFI for FAS on CD20, CD4, CD8 and CD127‐CD25+ CD4+ T cells. FAS is expressed by CD4 and CD8 T cells and suggested to be increased in the few T cells that are enriched for T regulatory phenotype.
