
Figure 1.
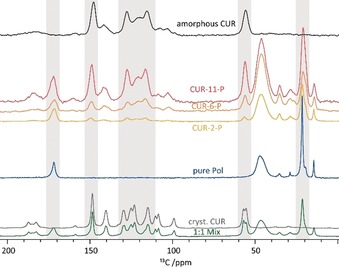
13C CP/MAS NMR spectra of amorphous CUR (black), the three formulations (yellow, orange, red with increasing CUR concentration), pure polymer (blue), as‐received CUR (grey), and a 1:1 mixture of the two components (green). All spectra were recorded at 14.1 T and 24 kHz and scaled according to the number of scans of the individual datasets.