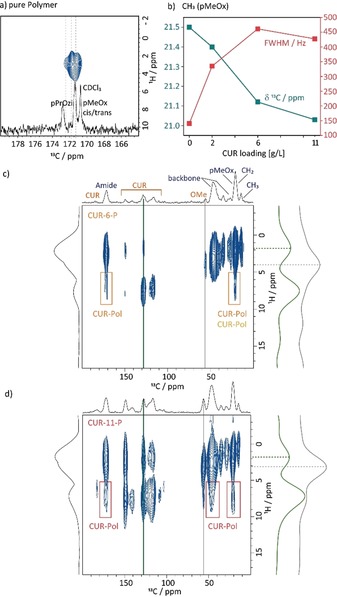
Figure 4.

a) Amide region of the 1H‐13C FSLG HETCOR spectrum of the pure polymer recorded with a contact time of 1.5 ms alongside the 13C NMR spectrum in CDCl3 (full 2D spectrum in the Supporting Information). b) Comparison of the chemical shift (green) and line width (red) of the CH3 group of the hydrophilic polymer block pMeOx for the pure polymer and the three formulations. c) and d) 1H‐13C FSLG HETCOR spectra of CUR‐6‐P and CUR‐11‐P recorded at 14.1 T and 20 kHz MAS with a contact time of 5 ms alongside the vertical slices extracted as highlighted by the coloured bars. Coloured boxes indicate cross‐peaks originating from CUR–Pol intermolecular contacts. The 2D dataset of CUR‐2‐P can be found in the Supporting Information.
