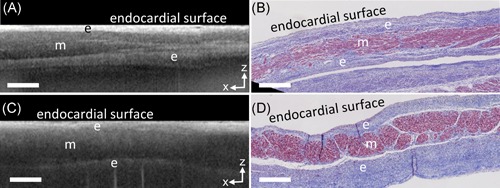
Figure 2.

Structures at the septum, as viewed from the endocardial side of the left atrium, imaged transmurally by optical coherence tomography (OCT). A, OCT b‐scan of the septum primum. B, Corresponding histology to A. C, OCT b‐scan at the fossa ovalis. D, Corresponding histology to C. Scale bars indicate 0.5 mm. e, endocardium, m, myocardium
