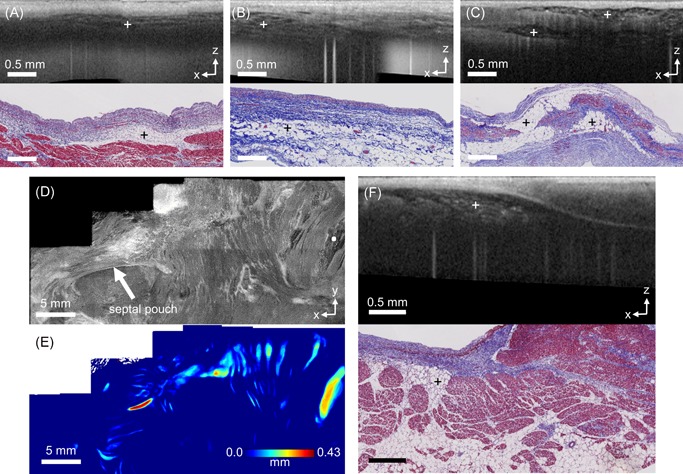
Figure 3.

Adipose distributions in human left atrial tissue, as imaged by optical coherence tomography (OCT). A, OCT B‐scan (top) and histology (bottom) of adipose overlying a myocardial sleeve in a pulmonary vein. B, OCT B‐scan (top) and histology (bottom) of adipose tissue from the fibrofatty adventitia. C, OCT B‐scan (top) and histology (bottom) of adipose tissue in the septum primum. D, En face OCT image around the fossa ovalis (top), shown 0.26 mm from the endocardial surface, showing adipose tissue distributed over a wide area. The white dot in the en face OCT image corresponds to the location of the B‐scan shown in F. E, Corresponding adipose thickness map to D. F, OCT B‐scan (top) and histology (bottom) of adipose near the fossa ovalis. The crosses mark the areas of adipose tissue
