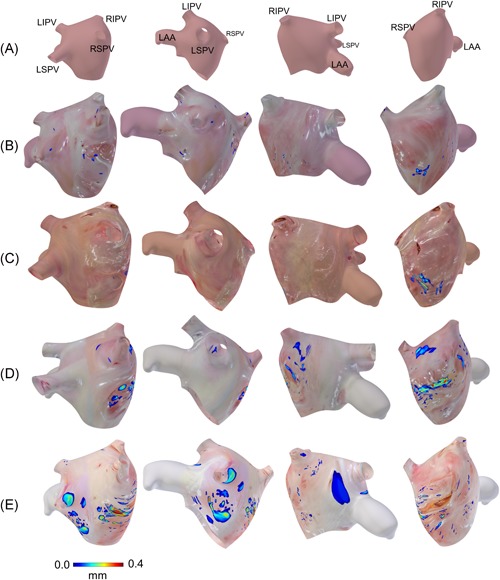
Figure 4.

Adipose thickness distributions in the human left atria, as extracted from optical coherence tomography (OCT) images and superimposed on 3D anatomical models. The adipose thickness is shown as a color map, while areas where adipose was not seen instead show camera images of the left atrial tissue. The models are shown in four views. A, Reference model, showing the location of the pulmonary veins and left atrial appendage relative to the view. Note that the left atrium is inverted, such that the endocardial surface faces outwards. B, Adipose thickness distribution from heart #7. C, Adipose thickness distribution from heart #1. D, Adipose thickness distribution from heart #5. E, Adipose thickness distribution from heart #6. Adipose thickness distributions for hearts #2 and #4 are given in the Figure S1. LAA, left atrial appendage; LIPV, left inferior pulmonary vein; LSPV, left superior pulmonary vein; RIPV, right inferior pulmonary vein; RSPV, right superior pulmonary vein
