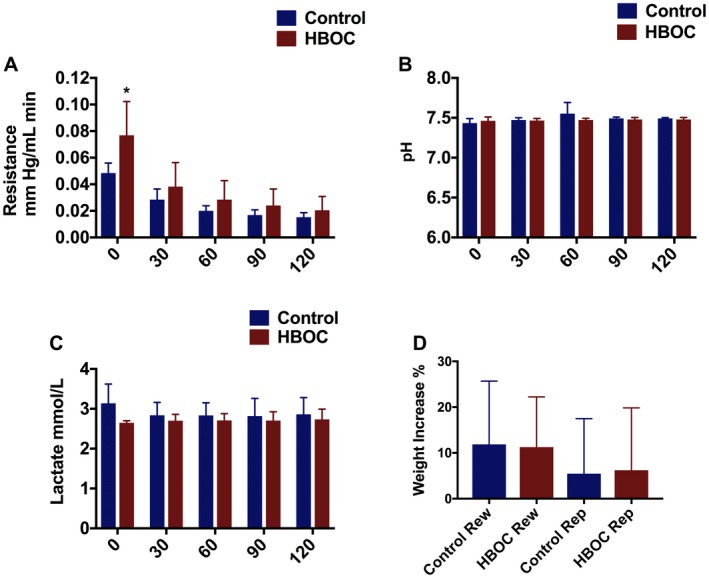
Figure 4.

Kidney profile during reperfusion. A, Resistance was high in the both groups in the beginning of the reperfusion with significant difference, and then was reduced in both groups toward the end of reperfusion with no difference. B, pH was in normal range in the both groups with no significant difference. C, There was no significant difference in the lactate level between both groups. D, This graph indicates the weight gain during rewarming and reperfusion phase in both groups with no significant difference. *P ≤ 0.05 [Color figure can be viewed at https://www.wileyonlinelibrary.com]
