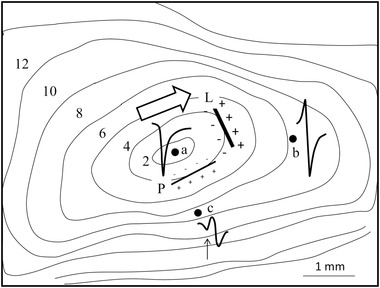
Figure 2.

Isochronal map of a sub‐epicardial sheet of myocardium superfused in a tissue bath and stimulated at the center (site a). The bold arrow shows major fiber direction in the middle part of the tissue. Three electrograms are shown. The electrogram at the site of stimulation (site a) is negative. At site b, at a distance from the site of stimulation, activation passes the electrode resulting in a biphasic deflection with similar amplitudes for the positive and negative deflection. At site c, activation is passing during propagation perpendicular to the fiber direction. The biphasic deflection of the passing front is preceded by a negative one (arrow), which is remote and caused by activation running away from the recording site in the fiber direction. Numbers are activation times with respect to the onset of stimulation. The two straight lines schematically mark two dipole fields at time 4 ms for activation parallel and perpendicular to fiber direction. Electrode diameter: 0.05 mm; inter‐electrode distance: 0.15 mm; reference electrode: border of tissue bath; filter setting: 0.1‐30 kHz. (Adapted from Spach MS et al., Circ Res 1979;45:188‐204)
