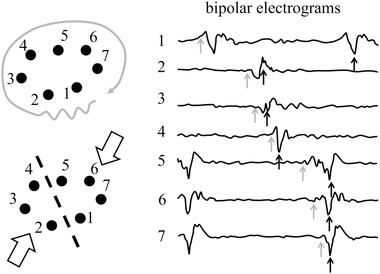
Figure 8.

Right panel: Bipolar electrograms recorded at seven sites during an atrial arrhythmia. The position of the electrodes is indicated by the black dots in the left panels. Gray arrows indicate “activation times” if the onset of the bipolar deflections is (erroneously) chosen as activation time. The corresponding activation pattern at the left suggests re‐entrant activation (left upper panel). Black arrows indicate activation times if the largest positive or negative deflection is chosen as activation time. Now the activation map shows that recordings are made at a site where two activation fronts collide (left lower panel). Electrode size: 1 mm; inter‐electrode distance: 4 mm; reference electrode: WCT; filter setting: 30‐500 Hz
