
. 2019 Aug 18;27(1):144–e3. doi: 10.1111/ene.14048
© 2019 The Authors. European Journal of Neurology published by John Wiley & Sons Ltd on behalf of European Academy of Neurology
This is an open access article under the terms of the http://creativecommons.org/licenses/by-nc-nd/4.0/ License, which permits use and distribution in any medium, provided the original work is properly cited, the use is non‐commercial and no modifications or adaptations are made.
Figure 1.
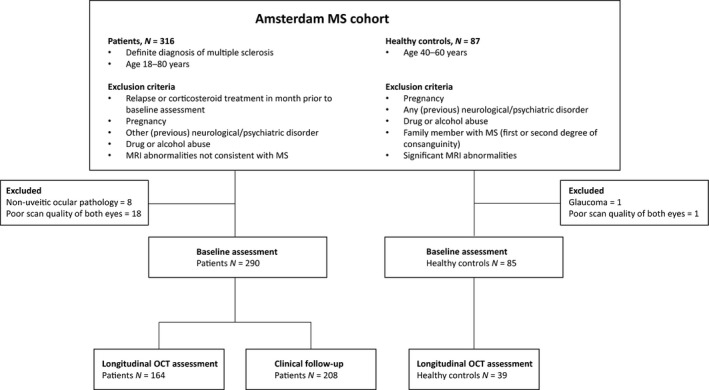
Flowchart illustrating the inclusion and exclusion of study subjects.