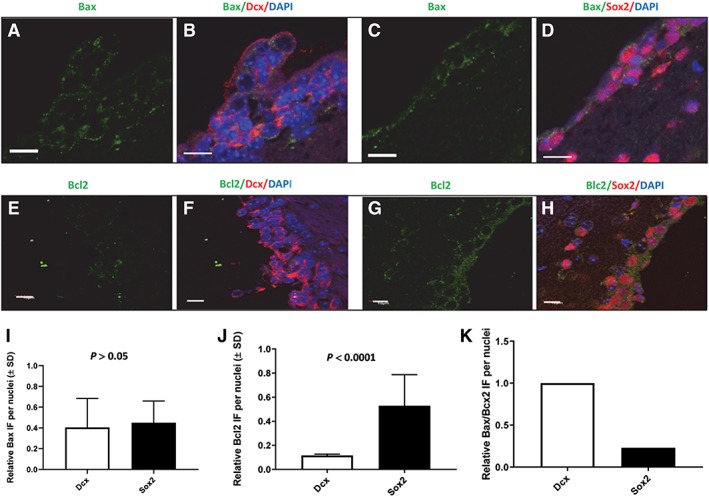
Figure 5.

Bax and Bcl2 expression in Dcx neuroblasts and in Sox2 neural stem cells (NSCs) located within 30 μm of a ventricle of the ventricular–subventricular zone obtained from nontumor‐bearing sham‐treated female mice. Panels (A)–(D) illustrate coimmunostaining for Bax (false green, Cy2), Dcx (false red, Cy5), and Sox2 (false red, Cy7). Panels (A) and (B) illustrate Bax and Dcx immunostaining. Panels (C) and (D) illustrate Bax and Sox2 immunostaining. Panels (E)–(H) illustrate coimmunostaining for Bcl2 (false green, Cy2), Dcx (false red, Cy5), and Sox2 (false red, Cy7). Panels (E) and (F) illustrate Bcl2 and Dcx immunostaining. Panels (G) and (H) illustrate Bcl2 and Sox2 immunostaining. Panel (I) illustrates quantification of Bax expression in Dcx‐expressing and Sox2‐expressing cells. Panel (J) illustrates quantification of Bcl2 expression in Dcx‐expressing and Sox2‐expressing cells. Panel (K) illustrates relative Bax/Bcl2 ratios for Dcx and Sox2‐expressing cells. DAPI staining is blue. White bar = 10 μm. The confocal images illustrate immunofluorescence throughout 4.92 μm of the Z axis.
