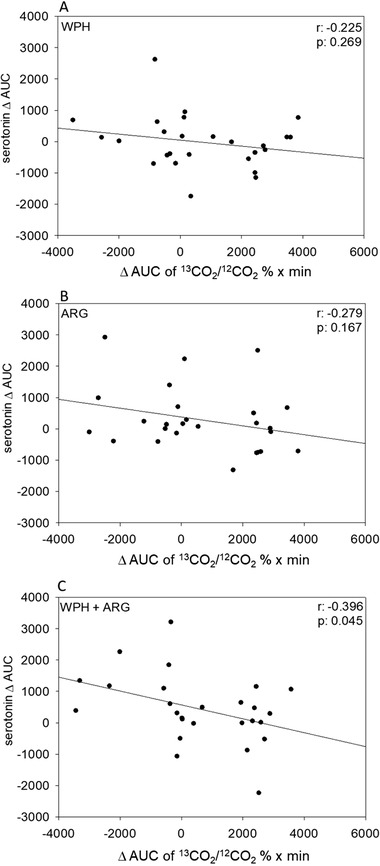
Figure 5.

A–C) Correlation analysis between Δ AUC plasma serotonin and ∆ AUC of 13CO2/12CO2 % × min rates (NV control was subtracted from interventions) after WPH, ARG, or WPH + ARG intervention. Correlation coefficients were computed by means of Pearson Product‐Moment Correlation method. For intervention, a significant correlation was demonstrated, with WPH+ARG (r = −0.396, p = 0.045).
