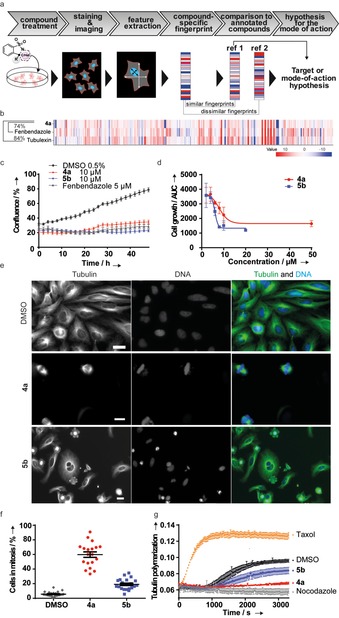
Figure 1.

Influence of benzo‐sulfonamides 4 a and 5 b on cell growth, mitosis and tubulin polymerization. a) Schematic representation of morphological profiling, for example, the cell painting assay.28 b) Fingerprint comparison for 4 a (10 μm) with fenbendazole (3 μm) and tubulexin A (50 μm). c) The growth of U2OS cells was monitored for 48 h using kinetic live‐cell imaging in presence of the compounds or DMSO and fenbendazole as controls. Data are mean values (N=6)±SD and are representative of three biological replicates. d) Dose‐response analyses for cell growth inhibition were carried out as described in (a). The area under the curve was used to determine IC50 for cell growth inhibition. IC50 (4 a)=7.8±1.6 μm; IC50 (5 b)=6.0±0.4 μm. Data are mean values (N=3)±SD and are representative of two biological replicates. e) U2OS cells were treated with the compounds for 24 h prior to staining of DNA and tubulin using DAPI (blue) and anti‐alpha‐tubulin‐FITC antibody (green). Scale bar: 20 μm. f) U2OS cells were treated with the compounds for 24 h prior to staining for phospho‐histone 3 as a marker for mitotic arrest and DNA followed by automated image acquisition and analysis to quantify the percentage of cells in metaphase (i.e., phospho‐histone 3‐positive cells). Data are mean values (N=2)±SD and are representative of three biological replicates. g) In vitro tubulin polymerization assay. Tubulin polymerization was initiated in the presence of GTP and was monitored by means of turbidity measurement at 340 nm at 37 °C. Taxol and nocodazole were used as controls for tubulin stabilizing and destabilizing agents, respectively. Data are representative of three biological replicates.
