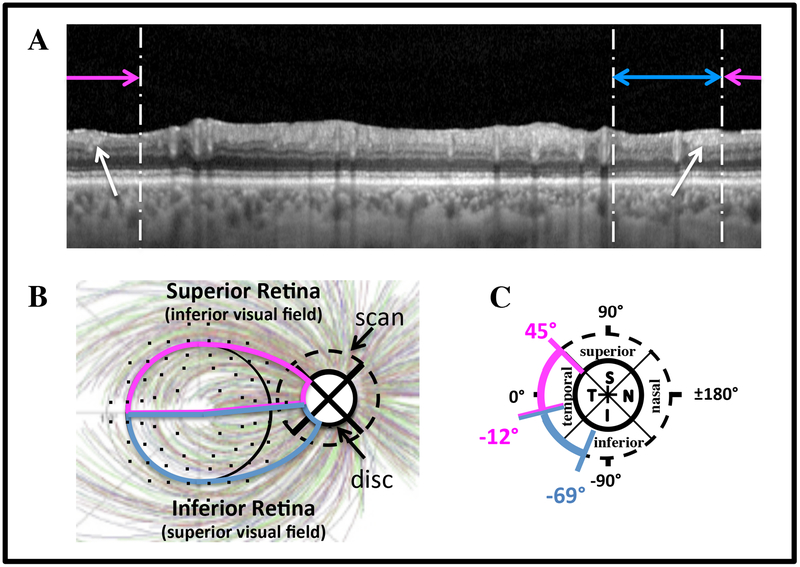
Figure 2:
A. The circular B-scan image from Fig. 1B without the segmentation lines. The horizontal lines indicate the regions associated with the superior macula/inferior visual field (magenta) and inferior macula/superior visual field (blue) according to the schematic model.13 B,C. Schematic model showing the relation between regions of the macula and regions of the disc. The RNFL tracings are from Jansonius et al.,16 and the 10–2 point locations are from Hood and Raza,13 based upon data from Drasdo et al.15

