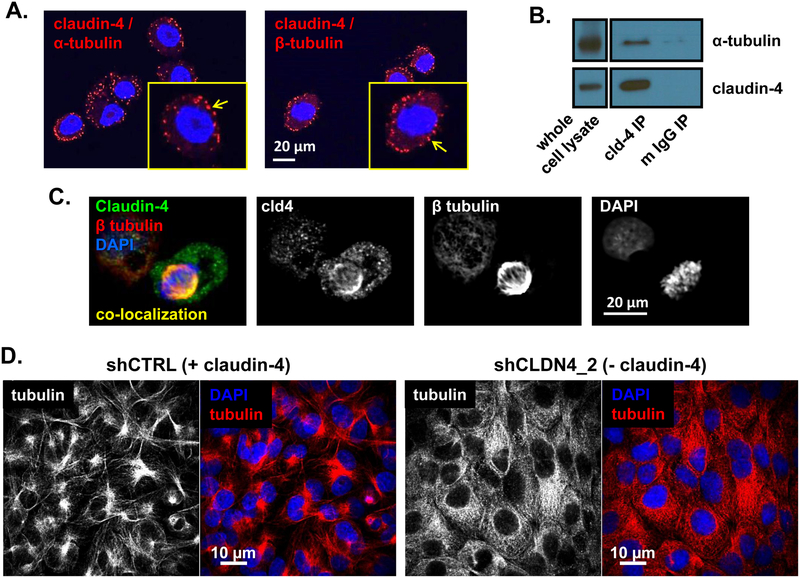
Figure 6: Claudin-4 interacts with tubulin.
(A) Proximity ligation assay using antibodies directed at claudin-4 and α-tubulin or β-tubulin. Red fluorescence indicates protein-protein interaction. Yellow outlined boxes are higher magnification of cell from image. Arrows point to sites of protein-protein interaction. (B) Immunoprecipitation (IP) of claudin-4 (cld-4 IP) and IgG (mouse IgG IP) from OVCAR3 lysates blotted for presence of α-tubulin and claudin-4. (C) Immunofluorescence of claudin-4 (green) and β-tubulin (red), with DAPI (blue), in mitotic OVCAR3 cell. Yellow color indicates co-localization of claudin-4 and β-tubulin. (D) Immunofluorescence of microtubules (β-tubulin; white/red) and nuclei (DAPI/blue) in cells expressing (shCTRL) and not expressing (shCLDN4_2) claudin-4.

