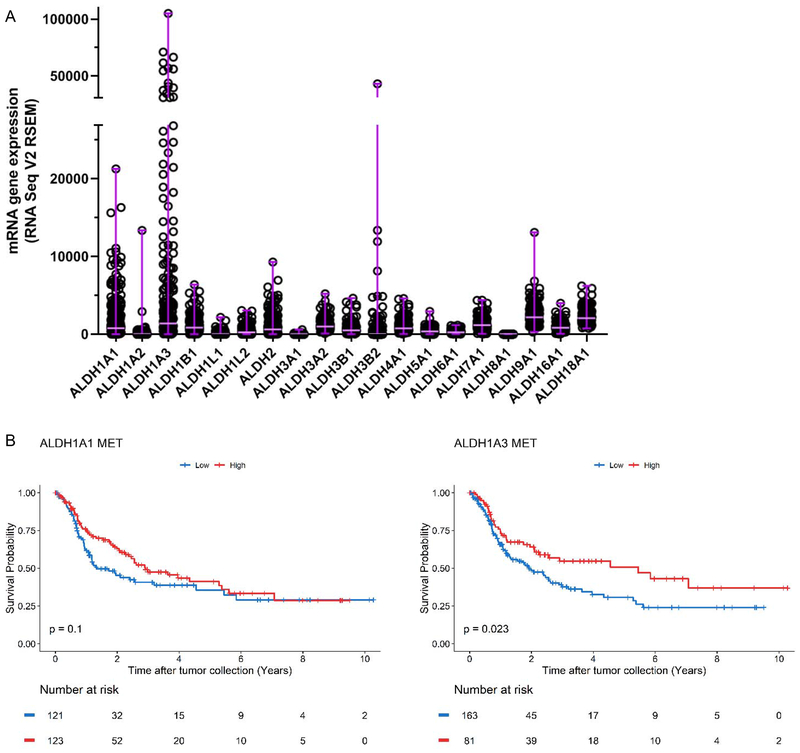
Figure 1: The prognostic value of ALDH1A1 and ALDH1A3 isozymes in metastatic melanoma.
(A) RNA Seq V2 RSEM values representing mRNA expression of all ALDH enzymes detected in metastatic melanoma, obtained from the SKCM TCGA provisional dataset. The median and range of each gene expression are shown using horizontal and vertical purple lines, respectively. (B) Kaplan Meier plot of ALDH1A1 (left, ALDH1A1 MET) and ALDH1A3 (right, ALDH1A3 MET) in metastatic patients. Patients above the gene expression threshold are shown in red and below in blue. The log-rank test was used to test for differences in overall survival between the two groups of each analysis.

