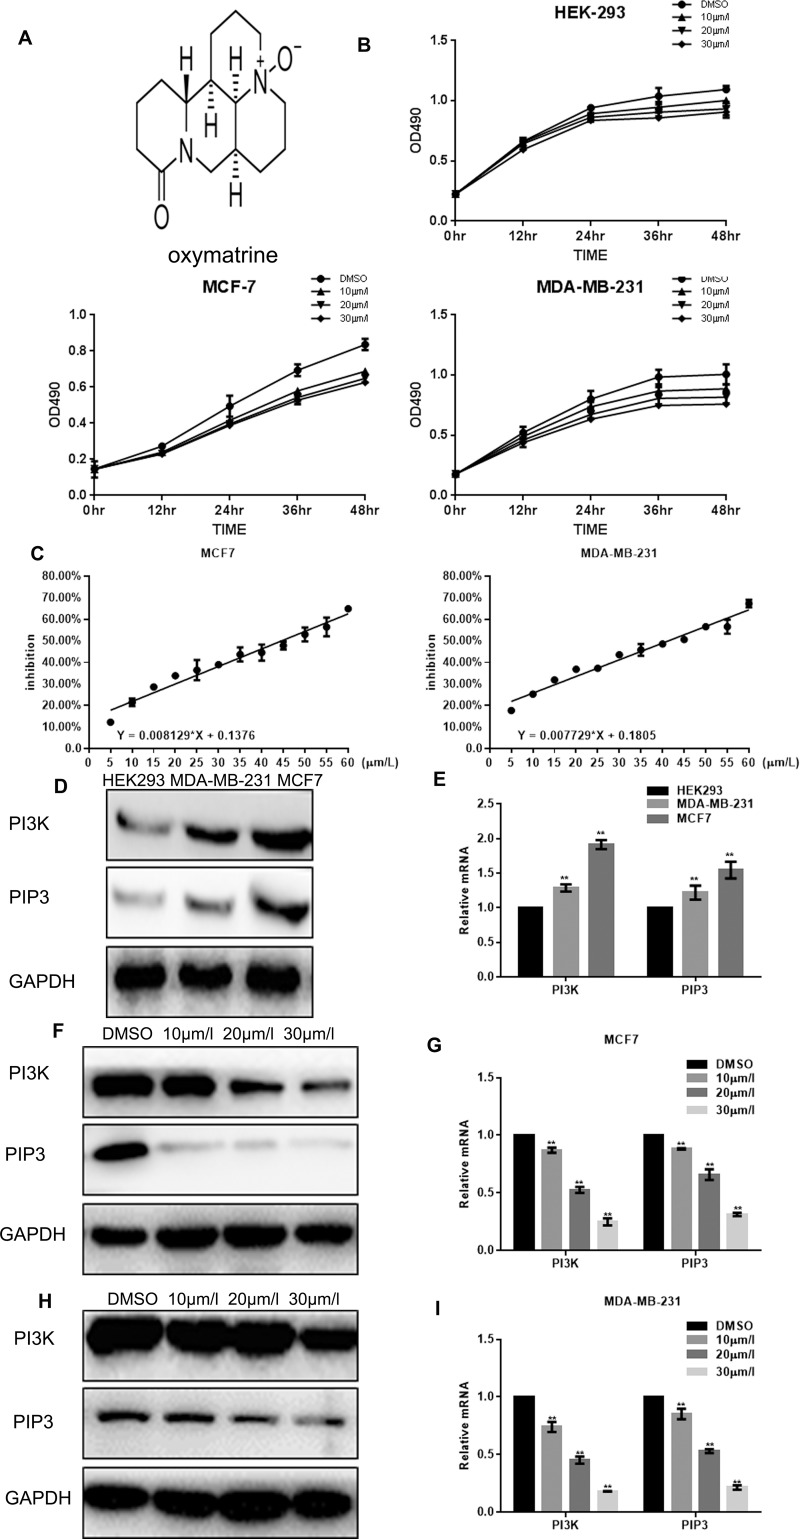
Figure 1.
Oxymatrine inhibits the proliferation of breast cancer cells. (A) Molecular structure of oxymatrine. (B) HEK-293, MCF-7 and MDA-MB-231 cells were cultured with the indicated concentrations of oxymatrine for the indicated times in 96-well plates. The MTT assay was carried out, and results are the mean ± SD of three experiments done in triplicate. (C) MCF-7 and MDA-MB-231 cells were cultured with the indicated concentrations of oxymatrine for the indicated times in 96-well plates. The MTT assay was carried out to calculate the inhibition of cell proliferation by oxymatrine, and the results are the mean ± SD of three experiments done in triplicate. (D) HEK-293, MCF-7 and MDA-MB-231 cells were cultured with the indicated concentrations of oxymatrine for 24 hrs, and PI3K expression was measured by Western blotting. (E) HEK-293, MCF-7 and MDA-MB-231 cells were cultured with the indicated concentrations of oxymatrine for 24 hrs, and PI3K expression was measured by real-time RT-PCR. (F) MCF-7 cells were treated with DMSO alone or with the indicated concentrations of oxymatrine for 24 hrs, and PI3K expression was measured by Western blotting. (G) MCF-7 cells were treated with DMSO alone or the indicated concentrations of oxymatrine for 24 hrs, and PI3K expression was measured by real-time RT-PCR. Results represent the mean ± SD of three experiments done in triplicate. (H) MDA-MB-231 cells were treated with DMSO alone or the indicated concentrations of oxymatrine for 24 hrs, and PI3K expression was measured by Western blotting. (I) MDA-MB-231 cells were treated with DMSO alone or the indicated concentrations of oxymatrine for 24 hrs, and PI3K expression was measured by real-time RT-PCR. Results are the mean ± SD of three experiments done in triplicate. **P < 0.01, compared with the control group.

