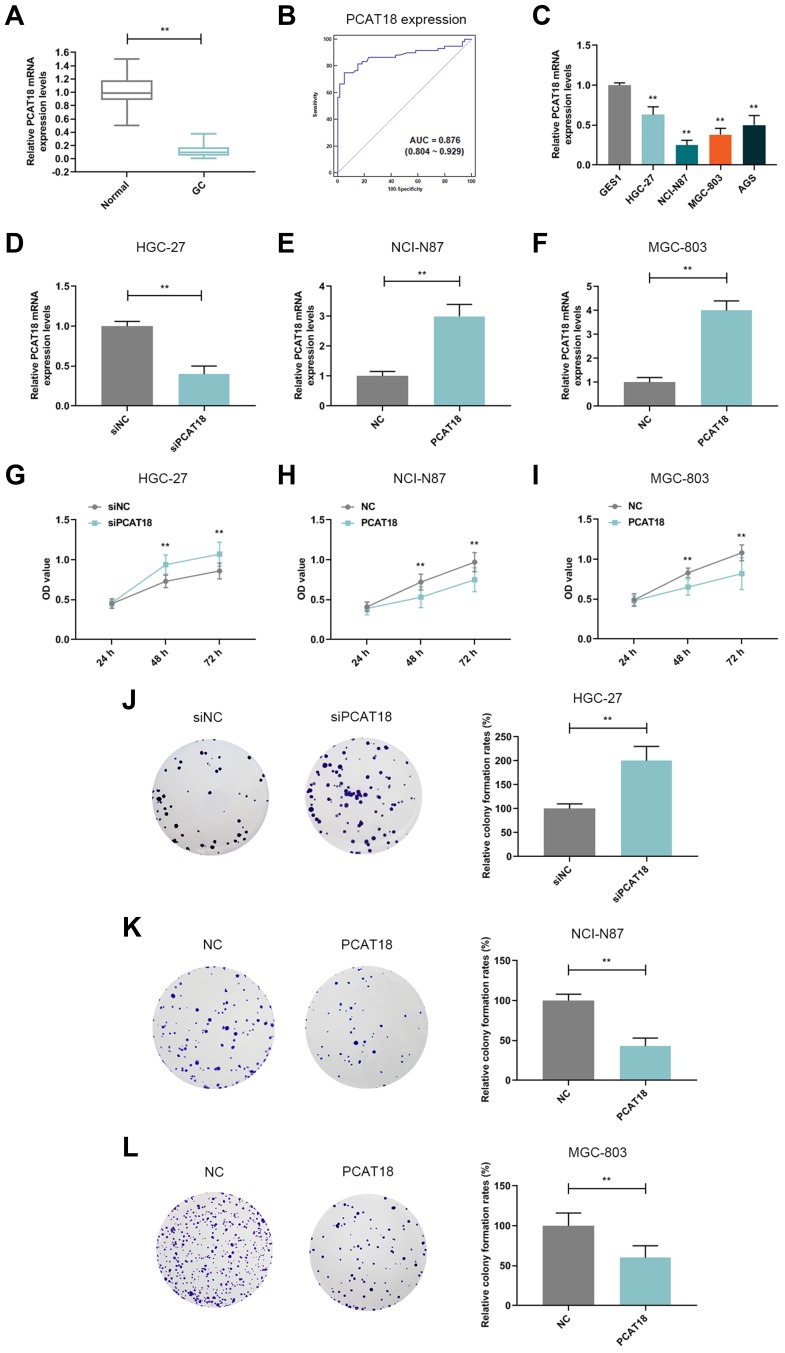
Figure 1.
PCAT18 was down-regulated in GC tissues and cells and it inhibited cell growth of GC cells. (A) The level of PCAT18 in GC and adjacent normal tissues was determined by qRT-PCR. n= 60. **P<0.001 vs. Normal. GC: Gastric Cancer. Normal: adjacent normal tissues. (B) ROC curve for the prediction of GC based on PCAT18 expression level, the AUC was 0.876 (95% CI 0.804‐0.929). (C) The level of PCAT18 in normal gastric epithelial cells and GC cell lines was measured by qRT-PCR. **P<0.001 vs. GSE1. (D,E) The efficiency of the knockdown (D) or overexpression (E and F) of PCAT18 in GC cells was measured by qRT-PCR. **P<0.001 vs. siNC or NC. (G–I) The cell viabilities of GC cells after transfection for 24h, 48h and 72h were determined by CCK-8 assays. **P<0.001 vs. siNC or NC. (J–L) The cell growth abilities of GC cells were determined by colony formation assays. **P<0.001 vs. siNC or NC.
Abbreviation: ROC curve, receiver operating characteristic curve.

