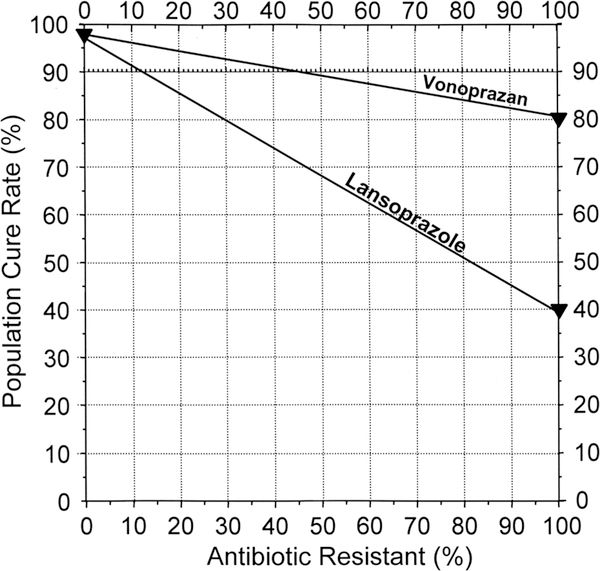
Figure 2.
Hp-normogram. This normogram plots the cure rate with susceptible infections on the left vertical axis and those with resistant infections on the right vertical axis. The proportion with resistance is shown on the horizontal axis.4 The cure rates are connected with a line allowing one to visualise the population cure rates for any prevalence of resistance. This plot shows the cure rates with vonoprazan and lansoprazole triple therapies (cure rate with susceptible strains of 97% for both and 82% vs 40% for vonoprazan and lansoprazole, respectively. Note that the lines diverge such that at 15% clarithromycin resistance the cure rates would differ by only 6%.

