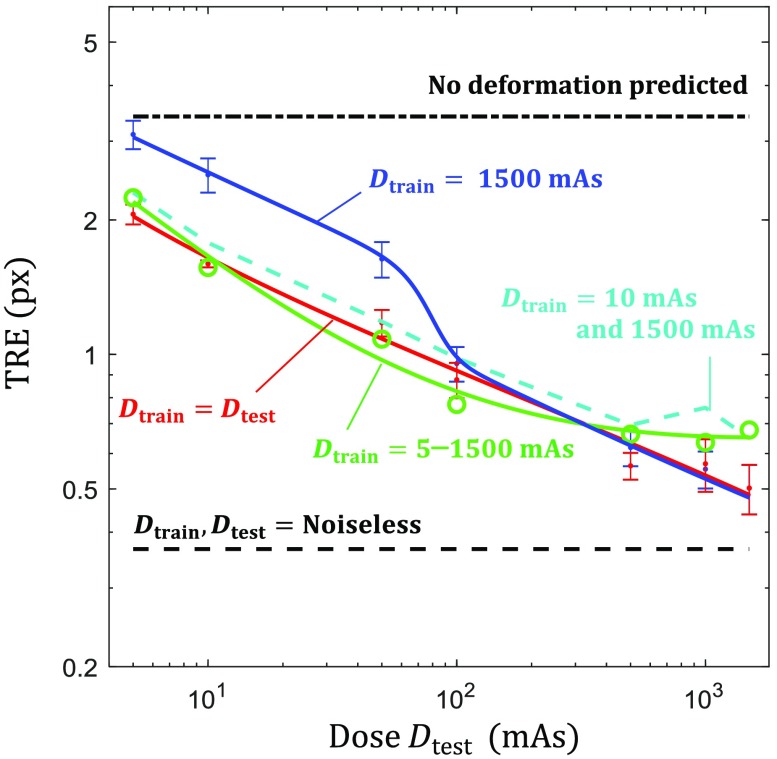
Fig. 5.
Diverse dose training. The green ( to 1500 mAs) line shows TRE performance for the diversely trained (with respect to dose) network and the cyan dashed line depicts error when half the training data were 10 mAs and half were 1500 mAs. The blue () and red () solid lines from Fig. 4 are provided for reference.

