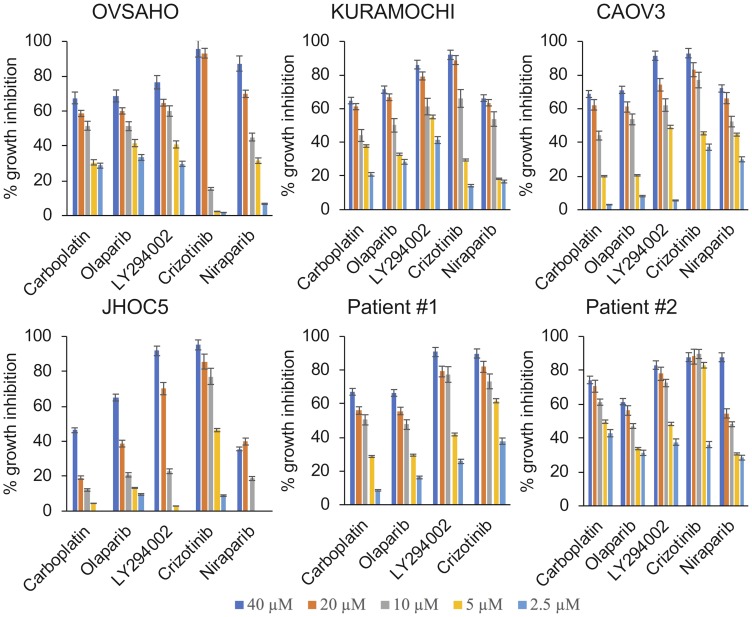
Figure 1. Cytotoxic and growth inhibitory effects of single agent treatments.
The HGSOC cell lines KURAMOCHI, OVSAHO and CAOV3, the OCCC cell line JHOC5 and primary cells obtained from ascites from patients diagnosed with HGSOC were treated with increasing concentrations of the respective drugs (2.5 µM–40 µM) for 1 week and the growth inhibitory effects were analyzed using the NCI-SRB Assay.

