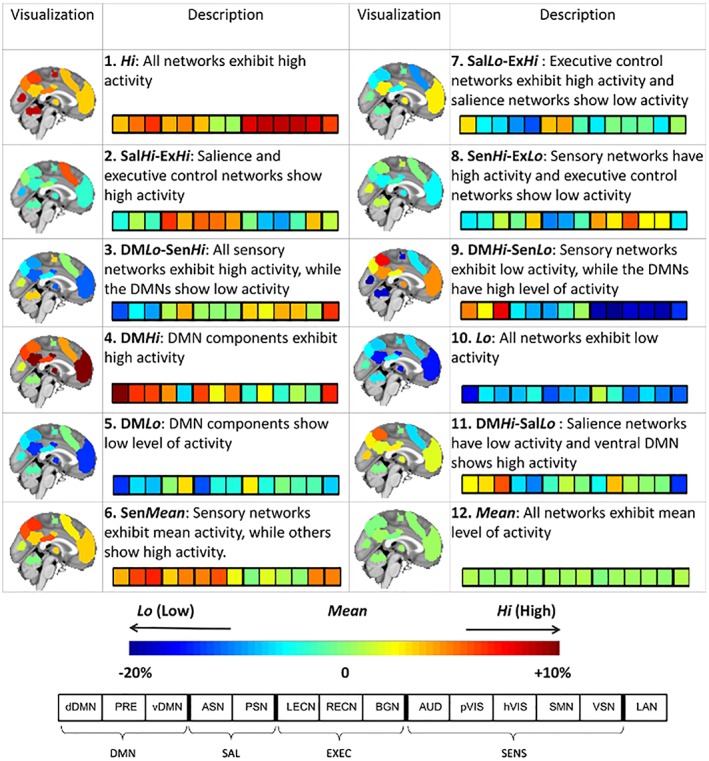
Figure 2.

Characterization of inferred brain states. A HMM was used to decompose functional MRI dynamics in 14 predefined RSNs into a sequence of 12 repeating brain states. Brain activation maps illustrate the level of normalized BOLD activity within the regions comprising each RSN. The 12‐segment bar provides a summary of the activation pattern characterizing each state. Data used to infer the HMM were normalized, and thus an activation of zero corresponds to the mean level of activation (green shades). The activation of each RSN is expressed as a percentage above or below the mean level of activation. DMN, default mode networks; SAL, salience networks; EXEC, executive control networks; SENS, sensory networks. Supporting Information Table 1 provides details about the 14 RSNs [Color figure can be viewed at http://wileyonlinelibrary.com]
