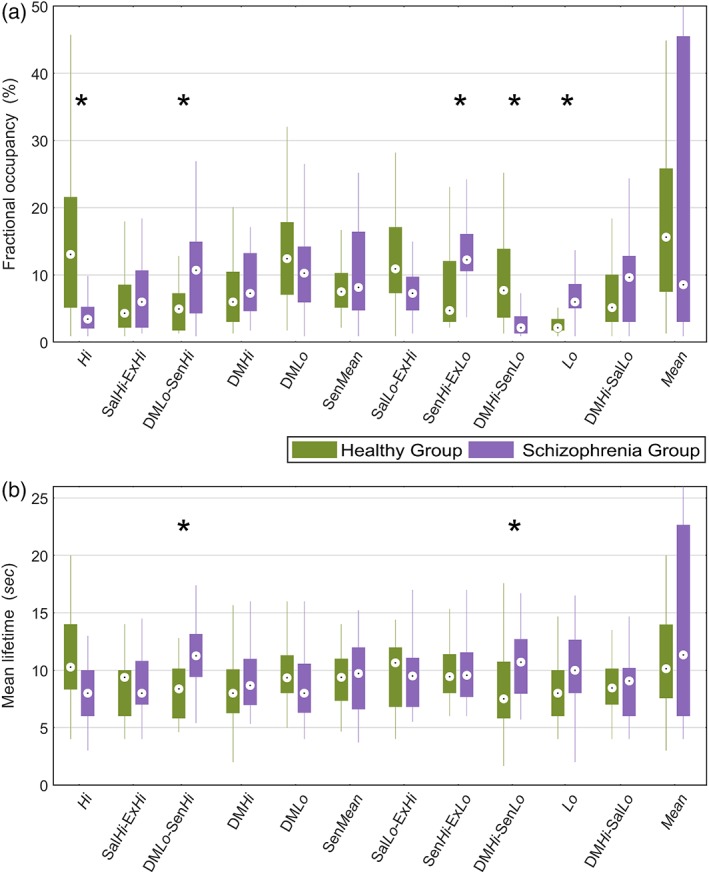
Figure 3.

Comparison of fractional occupancy and mean lifetimes between schizophrenia and healthy comparison groups for states inferred from the HMM. (a) Comparison of fractional occupancy times for each of the 12 states inferred from the HMM. A state's fractional occupancy is the proportion of time that an individual resided in the state during the scan acquisition. (b) Comparison of mean lifetimes for each state. A state's mean lifetime is the average time an individual resided in the state during each visit. Permutation tests (Section 2.7) were performed to assess the null hypothesis of equality in fractional occupancy times between the schizophrenia and healthy comparison group. Asterisks (*) denote p < 0.05. Boxplots: upper (lower) box edge, 25th (75th) percentile; central dot, median; thin lines, 1.5 x interquartile length [Color figure can be viewed at http://wileyonlinelibrary.com]
