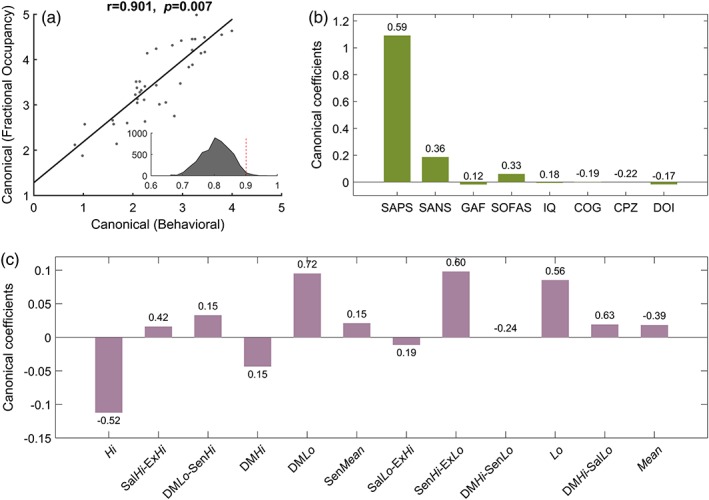
Figure 5.

Association between interindividual variation in fractional occupancy times and severity of clinical symptoms and cognitive deficits. CCA was performed to test for multivariate associations between interindividual variation in fractional occupancy times for 12 brain states and eight measures of symptom severity, cognition, and clinical characteristics. (a) Scatter plot of canonical scores for the significant CCA mode. Solid black line denotes line of best fit. A correlation of 0.91 (p = 0.007, family‐wise error corrected) was observed between the canonical covariates. The inset shows the distribution of correlation coefficients across 5,000 null instantiations (mean = 0.8). The dotted red line represents the observed correlation coefficient of 0.91, which is significant (p < 0.01) with respect to the null distribution. (b) Canonical coefficients corresponding to the eight summary measures. These measures are described in Supporting Information Table S2. SAPS, scale for the assessment of positive symptoms; SANS, scale for the assessment of negative symptoms; GAF, global assessment of functioning; SOFAS, social and occupational functioning assessment scale; IQ, intelligence quotient; COG, a generalized measure of cognition; CPZ, chlorpromazine equivalent dosage; DOI, duration of illness. (c) Canonical coefficients corresponding to fractional occupancy times of the 12 states. Figure 2 provides a description of each state. The value indicated above/below each bar indicates the Pearson correlation coefficient between the corresponding variable and its canonical covariate. Whereas the height of each bar indicates the extent to which each variable is up‐ or down‐weighted in relation to its canonical covariate, the correlation coefficients provides a univariate measure of how strongly each variable is associated with its canonical covariate [Color figure can be viewed at http://wileyonlinelibrary.com]
