
Figure 6.
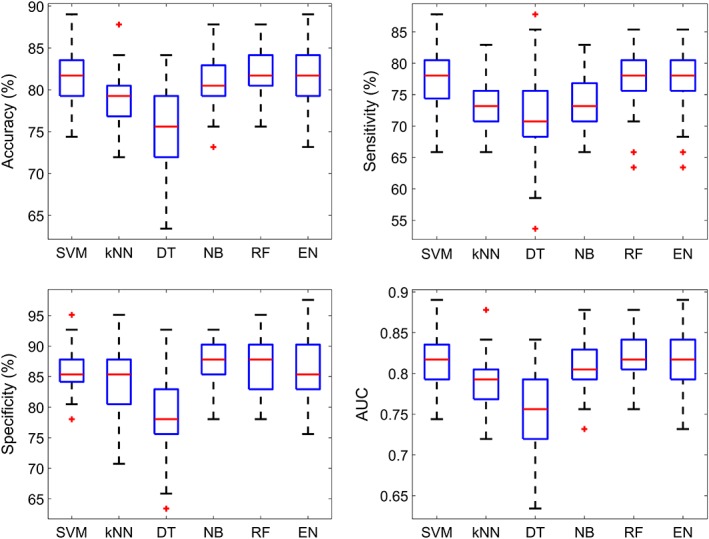
Box plots of different performance measures from single‐subject prediction of diagnostic status. The 12 state fractional occupancy values were used as subject‐specific features. Each box represents the distribution of a performance measure over 100 runs of 10‐fold cross validation. Blue box = 25–75 percentile, red line = median, black dotted lines = 9–91 percentile, red “+” = outliers. AUC, area under the curve; SVM, support‐vector machine; kNN, k‐nearest neighbor; DT, decision trees; NB, naive Bayes; RF, random forest; EN, ensemble of trees [Color figure can be viewed at http://wileyonlinelibrary.com]