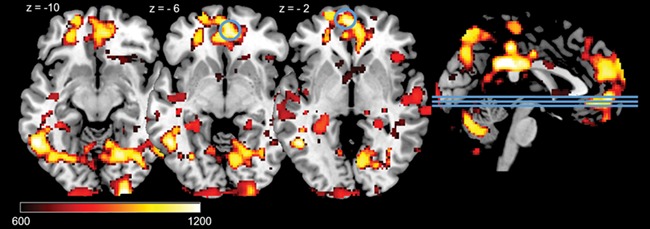
Fig. 3.

Positive correlations between HTC and significant ROI activations during positive pictures (positive - neutral) on voxel level P< 0.05 (FWE-corrected) in right and left OFC. Lines on the sagittal slices on the right side indicate the axial slices depicted on the left. Displayed TFCE-values are thresholded at TFCE > 600.
