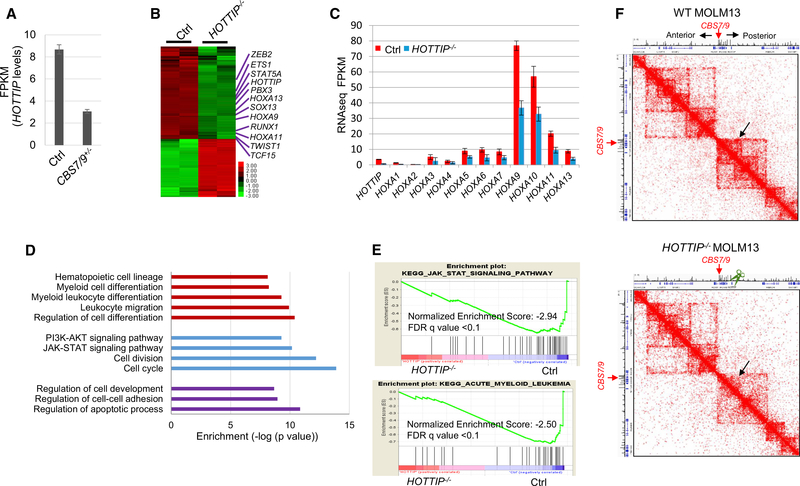
Figure 1. HOTTIP−/− Perturbs HOXA Gene-Mediated Oncogenic Transcription Program.
(A) HOTTIP levels in WT versus CBS7/9+/− MOLM13 cells by RNA-seq. FPKM, fragments per kilobase of transcript per million mapped reads.
(B) Heatmap of >2-fold up-and downregulated genes upon HOTTIP KO by RNA-seq.
(C) mRNA levels of HOXA genes in WT and HOTTIP KO MOLM13 cells.
(D) GO analysis of genes whose expression was altered by HOTTIP KO.
(E) Enrichment of decreased genes involved in JAK-STAT (top) and AML (bottom) pathways upon HOTTIP KO by GSEA.
(F) Hi-C interacting maps in part of the human chromosome 7p15 region containing the HOXA locus comparing WT and HOTTIP KO MOLM13 cells.
See also Figure S1.

