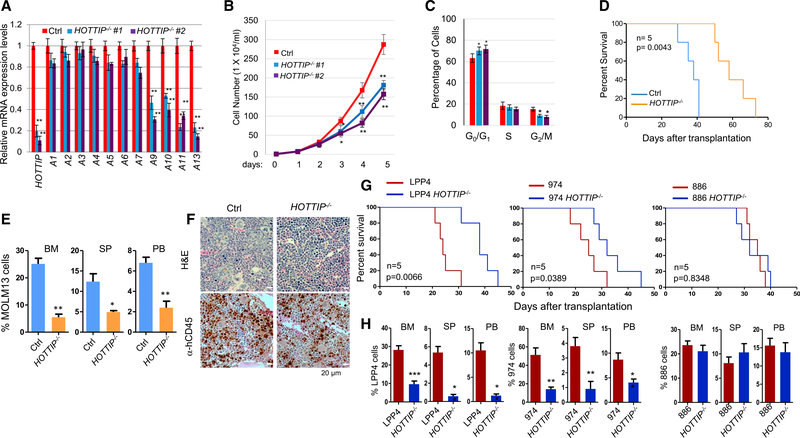
Figure 4. HOTTIP−/− Perturbs Cell Proliferation and Prolongs Survival of the Transplanted AML Mouse Models.
(A) qRT-PCR analysis of HOXA gene expression in WT and HOTTIP−/− MOLM13 clones.
(B) Proliferation curves of WT and HOTTIP−/− MOLM13 cells.
(C) Cell-cycle analysis of WT and HOTTIP−/− MOLM13 clones.
(D) Kaplan-Meier curves of NSG mice transplanted with WT and HOTTIP−/− MOLM13 cells.
(E) hCD45+ cell chimerism in BM, spleen (SP), and PB of NSG mice receiving WT (n = 4) or HOTTIP−/− (n = 4) MOLM13 cells.
(F) Hematoxylin and eosin (H&E) and anti-hCD45 immunostaining (brown) of femur sections from mice transplanted with WT or HOTTIP−/− MOLM13 cells for 16 days.
(G) Kaplan-Meier curves of NSG mice transplanted with WT or HOTTIP−/− primary AML patient BM cells carrying MLLr+ (LPP4), NPM1C+Flt3-ITD+ (974), or NPM1C−FLT3-ITD+ (886) mutations.
(H) hCD45+ cell chimerism in BM, SP, and PB of NSG mice receiving WT (n = 4) or HOTTIP−/− (n = 4) primary AML cells.
Data in (A), (B), (C), (E), and (H) are presented as mean ± SD; *p < 0.05; **p < 0.01; ***p < 0.001 by Student’s t test. See also Figure S4.

