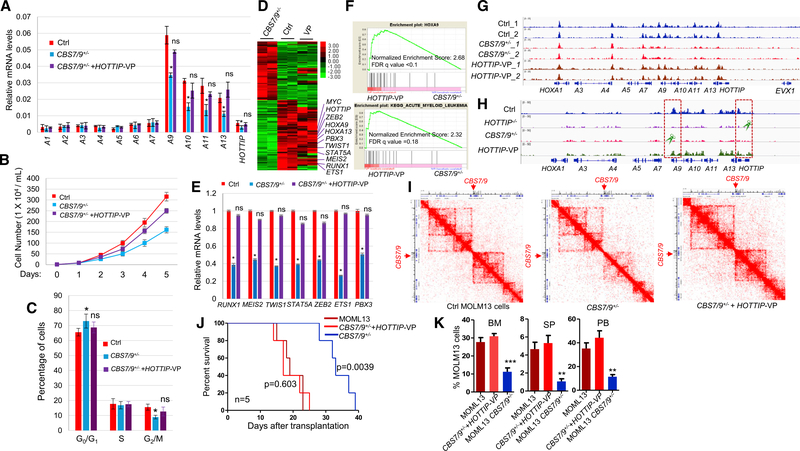
Figure 5. Activation of HOTTIP Rescues the HOXA Gene Chromatin Defects in the CBS7/9+/− AML Cells.
(A) qRT-PCR analysis of HOXA gene expression in WT, CBS7/9+/−, and the dCas9-VP-160-mediated HOTTIP-activated MOLM13 clones.
(B) Proliferation curves of the WT, CBS7/9+/−, and the dCas9-VP-160-mediated HOTTIP-activated MOLM13 cells.
(C) Cell-cycle analysis of the WT, CBS7/9+/−, and dCas9-VP-160-mediated HOTTIP-activated MOLM13 clones.
(D) Heatmap of RNA-seq analysis shows up-and downregulated genes of WT and the dCas9-VP-160-mediated HOTTIP-activated clones compared with the CBS7/9+/− clone.
(E) qRT-PCR validation of the key altered genes identified by RNA-seq comparing WT, CBS7/9+/−, and the dCas9-VP-160-mediated HOTTIP-activated clones.
(F) Enrichment of upregulated genes involved in HOXA9 (top) and AML (bottom) pathways upon HOTTIP activation in the CBS7/9+/− MOLM13 by GSEA.
(G) ATAC-seq analysis of chromatin accessibility in WT, CBS7/9+/−, and the dCas9-VP-160-mediated HOTTIP-activated MOLM13 cells.
(H) ChIP-seq analysis of MLL1 recruitment in WT, CBS7/9+/−, and the dCas9-VP-160-mediated HOTTIP-activated MOLM13 cells.
(I) Hi-C interacting maps in part of the human chromosome 7p15 region containing the HOXA locus comparing WT, CBS7/9+/−, and the dCas9-VP-160-mediated HOTTIP-activated MOLM13 cells.
(J) Kaplan-Meier curve of NSG mice transplanted with WT, CBS7/9+/−, or the dCas9-VP-160-mediated HOTTIP-activated MOLM13 cells.
(K) FACS analysis of hCD45+ cell chimerism in BM, spleen (SP), and PB of NSG mice 14 days after transplantation of WT (n = 4), CBS7/9+/− (n = 4), or the dCas9-VP-160-mediated HOTTIP-activated MOLM13 cells (n = 4).
Data in (A), (B), (C), (E), and (K) are presented as mean ± SD; *p < 0.05; **p < 0.01; ***p < 0.001; ns: not significant by Student’s t-test. See also Figure S5.

