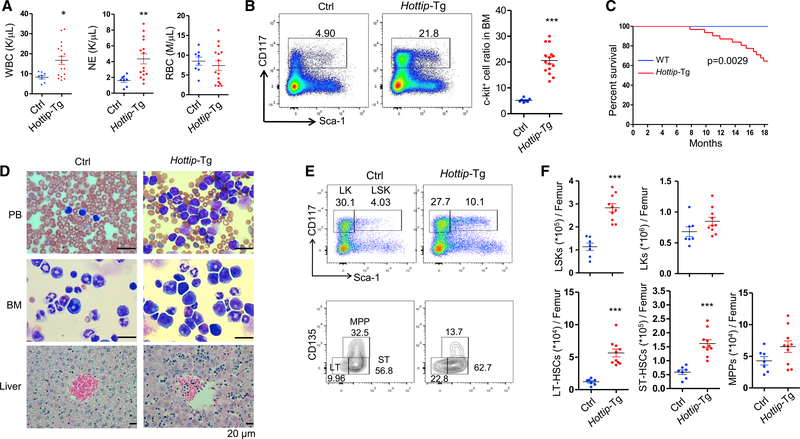
Figure 6. Hottip Transgenic Expression in Hematopoiesis Perturbs HSC Pools and Leads to AML-like Disease.
(A) Parameters of blood counts were summarized from 6- to 20-month-old Hottip-Tg (n = 15) and age-matched WT (n = 8) mice. WBC, white blood cells; NE, neutrophils; RBC, red blood cells. Data are presented as mean ± SD; *p < 0.05; **p < 0.01 by Student’s t test.
(B) FACS analysis and quantitation of c-Kit (CD117+) cells within total BM cells of 6- to 20-month-old WT (n = 7) and Hottip-Tg (n = 15) mice. Data show all dots as mean ± SD by Student’s t test. Horizontal bars represent mean. Data are presented as mean ± SD; ***p < 0.001 by Student’s t test.
(C) Kaplan-Meier curve of WT (n = 21) and Hottip-Tg (n = 31) mice over 20 months.
(D) Images of PB smears, BM cytospins, and liver sections prepared from representative WT and Hottip-Tg mice. Scale bar, 20 μm.
(E) FACS analysis of LSK and LK populations in the BM Lin− cells (top) as well as LT-HSC, ST-HSC, and MPP populations in the BM LSK cells (bottom) of representative young (8–16 weeks old) WT and age-matched Hottip-Tg mice.
(F) Quantitation of the total LSK, LK, LT-HSC, ST-HSC, and MPP populations per femur of young WT (n = 7) and Hottip-Tg (n = 10) mice. Quantitation data are presented as mean ± SD; ***p < 0.001 by Student’s t test.

