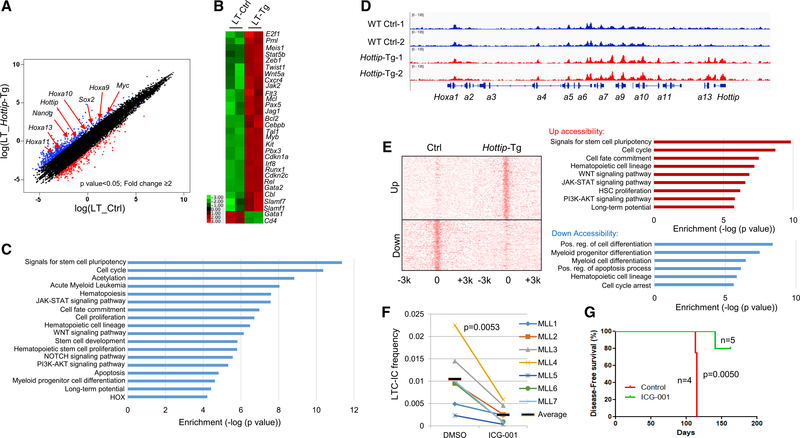
Figure 8. Transgenic Expression of Hottip Alters HSC Chromatin Signature and Hematopoietic Transcription Programs.
(A) Scatterplot of RNA-seq analysis of >2-fold differentially expressed genes upon overexpression of Hottip in BM LT-HSCs.
(B) Heatmap showing changed expression of representative genes upon Hottip overexpression.
(C) GO analysis of the HOTTIP affected genes.
(D) ATAC-seq analysis of chromatin accessibility in WT and Hottip-Tg BM LT-HSCs.
(E) ATAC-seq promoter density map of LT-HSCs sorted from WT and Hottip-Tg BM. Upregulated (top) or downregulated (bottom) ATAC-seq promoter peaks correlate with GO enriched pathways annotated by GREAT (gemomic regions enrichment of annotations tool) analysis.
(F) Primary MLLr+ AML patient samples with elevated HOTTIP expression were treated with DMSO or ICG-001 (500 nM) and the LT culture-initiating cells frequency of each group was determined. The black bars represent the mean frequency of each group. Data are presented as mean ± SD.
(G) Primary MLLr+ AML patient samples MLL7 (2.5 million cells) were transplanted into NSG mice. The mice were treated with vehicle (n = 4) or ICG-001 (50 mg/kg; n = 5) and sacrificed when they showed signs of illness.
See also Figure S8.

