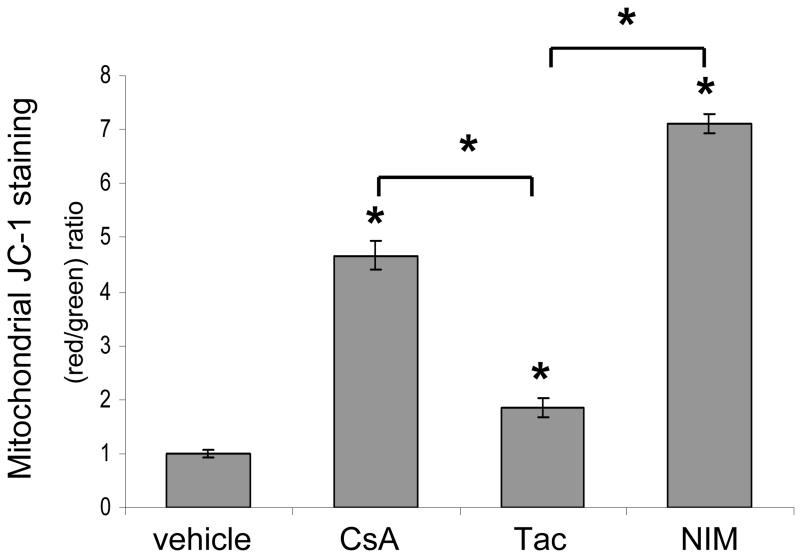
Fig. 3.
Mitochondrial membrane potential is maintained in UVA-irradiated cells treated with CypD-binding drugs. HaCaT cells were treated with vehicle and CsA, Tac, or NIM at 125 nM and repetitively irradiated with UVA. Mitochondrial depolarization was assessed as the fluorescence shift of JC-1 from red to green by flow cytometry analysis. Data are represented as a ratio of red to green fluorescence. Data represent means ± s.e.m. n=3. Asterisks directly above error bars indicate significant differences compared to vehicle treated cells, asterisks above brackets indicate significant differences between drug groups, *P < 0.05.

