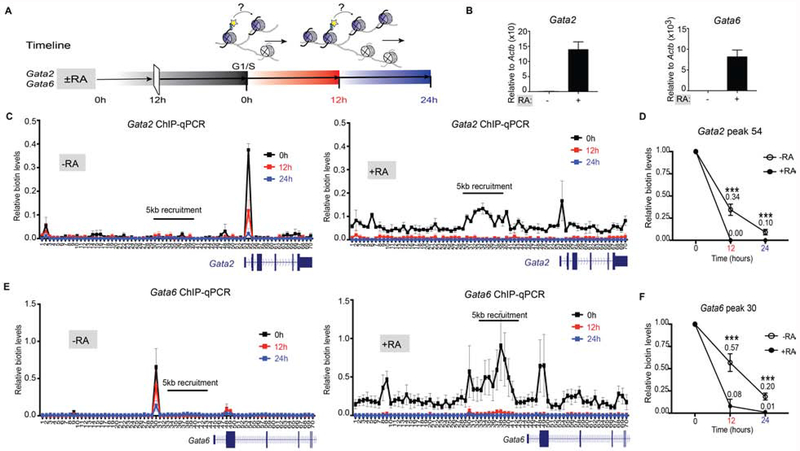
Figure 5. Altering repressed to active domains changes local parental H3 recycling.
(A) Experimental timeline whereby ESCs are ± 1 μM RA for 12 hr prior to synchronizing at G1/S phase (0 hr) and released to continue the cell cycle. Cells were harvested at 12 hr and 24 hr. (B) Relative mRNA expression of Gata2 and Gata6 genes in ESCs treated or not treated with RA for 48 hr. Data was normalized to Actin expression and minus RA control. (C-F) Native mononucleosomal biotin ChIP-qPCR in mESCs ± RA, blocked in G1/S and then released following a 6 hr pulse of Dox and exogenous biotin, with BirA targeted to the Gata2 (C-D) and Gata6 (E-F) loci. Data shows the average of 3 biological replicates spanning a 35 kb area at a resolution of 500 bp. For (D and F), graph highlights the biotin enrichment taken from the highest peak of the corresponding assays: Gata2 primer set 54 (C) and Gata6 primer set 30 (E). Biotin enrichment levels are relative to input and normalized to Drosophila chromatin spike-in followed by subtraction of the minus-Dox (-Dox) control. Error bars represent standard error of three biological replicates. For panels (D and F), the dataset for 0 hr was set to 1 and the statistical significance determined using 2way ANOVA (***p<0.001).

