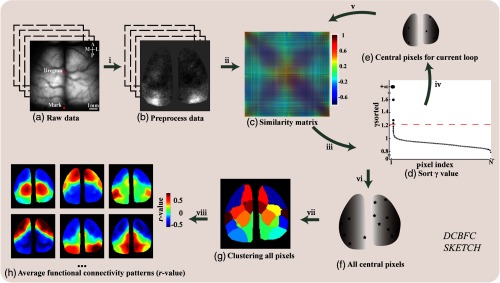
Fig. 1.
DCBFC Sketch. Step i: (a) Raw time-series fluorescent calcium images are acquired and processed with a 0.1- to 4-Hz bandpass. Then, (b) the preprocessed images are obtained by global signal regression. Step ii: (c) The similarity matrix using Pearson’s correlation between the time series is calculated. Then, a dataset is initialized. Step iii: The composite index values of all pixel are calculated, and (d) these values are sorted in descending order. The red-dotted line corresponds to the threshold . The pixels whose values are greater than are chosen as candidate central pixels. Step iv: The central pixels (e, black stars) of the current loop are screened out. Step v: Those pixels that are similar to the central pixels are removed from , and the similarity matrix of the remaining pixels is used for the next loop. Steps iii–v: are repeated until no central pixels are available to select. Step vi: (f) All central pixels are obtained. Step vii: (g) All the other pixels in the image are assembled to the clusters corresponding to their central pixels. Step viii: The seed pixel functional connection maps corresponding to all pixels in the same cluster are averaged, and (h) the RSFC patterns of all clusters are obtained.

